# Ad tech model
Source: https://methodology.scope3.com/ad_tech_model
# Methodology to Measure Emissions from Ad Tech Platforms
The ad tech platform (ATP) model is built around the idea that ATPs integrate with other ATPs as part of a directed graph starting from the publisher. For instance, making a bid request to an SSP will generate many more bid requests to DSPs and possibly to real-time data providers as well.
 ## Types of Ad Tech Platform
This model provides templates for various types of ATPs. In the words of Mike Nolet, what matters about ad tech companies is not what they say they are, it's what they actually do that matters. Thus, it doesn't really matter to the model whether a company is an ad network or an exchange or an SSP; what matters is how the company (or, technically, a particular product) integrates with publishers and other ad tech companies and what activities it performs.
The templates in the `templates` directory are used to pull default values for how a particular product is likely to operate in the above context.
## Ad Tech Provider Emissions Model
The ATP model assumes that there will be various requests coming from a publisher (on the left of the below diagram) that will trigger downstream actions (the white boxes) and consume various resources (the blue boxes).
 Running the ATP model in verbose mode will show the calculations being used, and they are detailed in the `./scope3_methodology/cli/model_ad_tech_platform.py` and `./scope3_methodology/ad_tech_platform`.
## Primary vs Secondary Emissions
Our model outputs the primary emissions from an ATP, in other words, what happens within the direct control of the ATP. This includes their scope 1, 2, and 3 emissions *except* for the emissions due to downstream distribution partners. In the context of a graph, this means we are outputting the emissions from each node, but not following the edges.
We do provide functions that can take a list of the edges (`DistributionPartner` objects) and will compute the secondary emissions. At Scope3, we first model all of the primary emissions then use our graph of ATP relationships to compute the fully-loaded cost of each type of request.
## Usage
Create a YAML file that describes the company you would like to model. The YAML file should look like this:
```yaml theme={null}
---
type: atp
company: Criteo
products:
- name: Criteo
template: network
identifier: criteo.com
# Facts directly used as model inputs
facts:
- server_emissions_mt_co2e_per_month: 3583
reference: page 85
source_id: 1
- server_emissions_g_co2e_per_kwh: 649.8
- corporate_emissions_g_co2e_per_bid_request: 0.00015648471735020598
comment: "Output of model Sept 20, 2022"
# Raw facts are not direclty used within the model. But give additional info
raw_facts:
- servers: 40000
reference: page 7
source_id: 1
- server_electricity_kwh_per_month: 5514583
reference: page 85
source_id: 1
- server_embodied_emissions_pct: 25
reference: page 86
source_id: 1
- server_electricity_kwh_per_server_per_month: 137.9
- server_adjusted_emissions_mt_per_month: 3583
comment: no adjustment needed because embodied emissions are included
sources:
- id: 1
year: 2021
url: >-
https://filecache.investorroom.com/mr5ir_criteo/1674/Criteo_CSR_Report_2021.pdf
file: Criteo_CSR_Report_2021.pdf
```
The file must have:
* `company` which is the name of the company
* `products` with at least one product
* Each product should specify a template from the `templates` directory
To model emissions, make sure defaults have been computed. Then run:
```sh theme={null}
./scope3_methodology/cli/model_ad_tech_platform.py --verbose [--corporateEmissionsG] [--corporateEmissionsGPerRequest] [company_file.yaml]
```
If you want to see how the secondary emissions would be modeled, pass in `-p N` where N is the number of partners to simulate.
## Caveats and Concerns
* There are not many public data sources available for ad tech companies. Criteo published its first sustainability report in the summer of 2022 - huge kudos! - and we have heard from many other companies that they are working on sustainability projects. Until we have more sources, we will not be able to make the generic model particularly accurate.
* The data we have, even from private sources, is spotty and inconsistent. This is largely because there has been no reason to gather sustainability data, and also because it can be very difficult to properly measure and allocate compute and other costs to particular products and activities. At AppNexus, we had a full time PhD working on capacity modeling!
* Ad tech companies are complicated and often have many products. For instance, using Criteo as an example, they have a retail media product, their retargeting network, and also operate as an SSP in certain cases. They recently purchased IPonWeb. There is no way to breakout or reasonably estimate the emissions per request for each of these. In many cases, it isn't possible to know from a particular ad tag or call which of these products is being used.
# Calculations
Source: https://methodology.scope3.com/calculations
# Detailed walkthrough of calculations
## Entity Definitions
### Channels
| Channel | Description |
| ------------------- | ---------------------------------------------- |
| `web` | Website that is not primarily social or CTV |
| `app` | Mobile app that is not primarily social or CTV |
| `social` | A social platform (Snapchat, Facebook, etc) |
| `ctv-bvod` | A TV-like streaming platform |
| `streaming-video` | Website or app with online video content |
| `digital-audio` | Audio content (podcasts, streaming music) |
| `dooh` | Digital out of home - billboards, transit, etc |
| `search` | A Search engine (Google, Bing, etc) |
| `linear-tv` | Scheduled broadcast or cable television |
| `traditional-radio` | Scheduled audio broadcast |
### Device Types
| Device type | Description |
| --------------- | ------------------------------------------- |
| `phone` | A phone |
| `tablet` | A tablet |
| `pc` | A pc with a monitor or a laptop |
| `tv` | A TV |
| `smart-speaker` | A smart speaker - Amazon Echo or equivalent |
### Network Types
| Network type | Description |
| ------------ | --------------------------- |
| `mobile` | A mobile network (3G/4G/5G) |
| `fixed` | A fixed network (broadband) |
### Video Player
| Field | Description |
| ------------------- | ------------------------------------------------------------------------ |
| `size_bytes` | Size of the javascript/html for a video player if present |
| `buffering_seconds` | Video player buffering - if player preloads content, leave blank |
| `download_trigger` | What starts the content download - impression, view (ie lazy load), play |
### [Ad Format](./creative#terminology-placements-ad-formats-creatives-and-assets)
| Field | Description |
| ------------------------ | -------------------------------------------------------------------------------------------- |
| `rendered_width_pixels` | Width of the creative when rendered. Leave blank for responsive (will assume screen width) |
| `rendered_height_pixels` | Height of the creative when rendered. Leave blank for responsive (will assume screen height) |
| `image_sizes` | Array of image dimensions (eg `["300x250", "70x70"]`) |
| `audio_duration_seconds` | Audio duration (if applicable) |
| `video_duration_seconds` | Video duration (if applicable) |
| `video_player` | Video player used to render video (if applicable) |
| `other_assets_bytes` | Metadata, text, html, etc |
| `ad_platforms` | Ad serving, verification, and measurement ad platforms wrapping or embedded in the ad format |
#### Sample Ad Formats:
300x250 programmatic banner
```
image_sizes = ['300x250']
rendered_width_pixels = 300,
rendered_height_pixels = 250
```
30 second audio inserted into a podcast
```
audio_duration_seconds = 30
```
15 second outstream video
```
video_duration_seconds = 15;
video_player = 'default',
rendered_width_pixels = 500,
rendered_height_pixels = 400
```
Native product carousel
```
image_sizes = ['400x400','400x400','400x400'],
other_assets_bytes = 7321,
rendered_height_pixels = 600,
rendered_width_pixels = 450
```
### Property
| Field | Description |
| ----------------------------------------------- | ---------------------------------------------------------------------------------------------- |
| `channels` | The channel(s) of this property |
| `average_seconds_per_session_excluding_ads` | The average length of a session on this property excluding ads (eg 44 min of a 60 min TV show) |
| `average_imps_per_session` | The average number of impressions per session |
| `average_data_kb_per_session_excluding_ads` | The average number of KB transferred during a session excluding ads |
| `video_bitrate_kbps` | The average bitrate for a CTV-BVOD property (e.g. 4200 kbps) |
| `ad_funded_percentage` | 0-100 The percentage of content funded by advertising (eg 50) |
| `allocated_adjusted_corporate_emissions_kgco2e` | This property's share of corporate emissions |
| `total_sessions` | Number of sessions in the same time period as corporate emissions |
| `organization_model_quality` | Parent organization model quality (1-5) |
| `model_quality` | Model quality (1-5) |
### Ad Platform
| Field | Description |
| ------------------------------------------------------- | ------------------------------------------------------------------------------------------- |
| `emissions_per_creative_request_per_geo_gco2_per_imp` | Adjusted, allocated emissions per creative request by continent (NAMER, LATAM, EMEA, JAPAC) |
| `usage_emissions_per_bid_request_per_geo_gco2_per_imp` | Adjusted, allocated emissions per bid request by continent (NAMER, LATAM, EMEA, JAPAC) |
| `usage_emissions_per_rtdp_request_per_geo_gco2_per_imp` | Adjusted, allocated emissions per rtdp request by continent (NAMER, LATAM, EMEA, JAPAC) |
| `bidders` | Array of ad platforms that are sent bid requests |
| `real_time_data_providers` | Array of ad platforms that are sent real-time data requests (not propagated) |
| `distribution_rate_by_bidder_by_country` | Traffic shaping data for each bidder by country (eg `'xandr.com', 'US', 0.58`) |
| `average_bid_request_size` | Average size of a client-side bid request |
| `sends_client_side_requests` | Does this platform send client-side bid requests (eg prebid client) |
| `model_quality` | Model quality (1-5) |
### Placement
| Field | Description |
| -------------- | ----------------------------------------- |
| `ad_platforms` | The ad platforms called by this placement |
### Delivery Row
| Field | Description |
| ------------------------------------------ | ----------------------------------------------------------------------------------------------------------- |
| `impressions` | The number of impressions counted (required for all channels other than DOOH) |
| `views` | The number of views counted |
| `plays` | The number of plays (required for DOOH) |
| `utc_datetime` | Date and time, in UTC, when impressions were delivered |
| `country` | The country where the impression was delivered |
| `region` | The region of the country where the impression was delivered |
| `channel` | See [channels](#channels) |
| `device_type` | See [device types](#device-types) |
| `network_type` | See [network types](#network-types) |
| `property` | See [property](#property) |
| `creative_ad_format` | Either a basic or vendor-provided ad format |
| `creative_ad_platforms` | Ad serving, verification, and measurement ad platforms wrapping or embedded in the creative |
| `creative_total_image_data_transfer_bytes` | Total bytes for the data transfer for the image itself for all impressions, ideally measured by the CDN |
| `creative_image_sizes` | Array of image sizes included in the creative |
| `creative_total_audio_data_transfer_bytes` | Total bytes for the data transfer for the core audio asset for all impressions, ideally measured by the CDN |
| `creative_audio_duration_seconds` | Average audio duration in seconds for a single impression |
| `creative_total_video_data_transfer_bytes` | Total bytes for the data transfer for the core video asset for all loads, ideally measured by the CDN |
| `creative_video_vast_bytes` | Average size of VAST/VPAID wrapper for the video in bytes for a single load |
| `creative_video_bitrate_kbps` | Video bitrate *as delivered* in kilobits per second |
| `creative_video_size_bytes` | Average video size *as delivered* in bytes for a single load |
| `creative_video_duration_seconds` | Video duration in seconds |
| `creative_video_view_time_seconds` | Average time, in seconds, that a video is viewed |
| `creative_video_view_rate` | Average percentage of a video that is viewed |
| `creative_time_in_view_seconds` | Time that the creative was visible on the device |
| `creative_is_3p_served` | Is the ad format served by a third party ad server |
## Defaults
### Conventional model data transfer by network type
The Scope3 values below are from [GMSF 1.2](https://adnetzero.com/wp-content/uploads/2025/06/GlobalMediaSustainabilityFrameworkV1.2.pdf).
SRI values from [SRIxAD database 2.1](https://github.com/SRISyndicatRegiesInternet/SRIxAD-DigitalCampaignsCarbonFramework/releases/download/v2.1.0/Referentiel.SRI.x.AD.-.V2.1_partage.zip), original source ADEME\_220830\_v1.4 (now considered outdated).
```
default_usage_kwh_per_gb:
scope3:
fixed: 0.0165
mobile: 0.117
sri:
fixed: 0.0687
mobile: 0.236
default_network_embodied_emissions_gco2e_per_kb:
scope3:
fixed: 0.00000214
mobile: 0.00000870
sri:
fixed: 0.00000443
mobile: 0.00000797
```
### Power model data transfer by network type
From [Carbon impact of video streaming (Carbon Trust)](https://ctprodstorageaccountp.blob.core.windows.net/prod-drupal-files/documents/resource/public/Carbon-impact-of-video-streaming.pdf), Table 5; and calculated [here](./data_transfer#fixed-network)
```
default_baseload_watts:
fixed: 9.55
mobile: 1.2
default_dynamic_watts_per_mbps:
fixed: 0.030
mobile: 1.53
```
### Mobile to fixed ratios by country
From [ITU Data Hub](https://datahub.itu.int/) (2024 data), these ratios do not apply to TV and Smart Speakers for which a specific `default_percent_mobile_by_device_type` is set.
```
default_percent_mobile:
scope3: 23.6
sri: 10.0
default_percent_mobile_by_country:
scope3:
AD: 2.982
AE: 12.538
AL: 11.136
AM: 12.329
AO: 81.256
AT: 42.451
AU: 10.022
AZ: 3.017
BD: 47.386
BE: 6.379
BG: 14.554
BH: 37.964
BJ: 80.867
BR: 14.080
BS: 6.093
BT: 99.203
BW: 50.891
BY: 18.362
CA: 3.853
CH: 17.137
CI: 45.733
CL: 16.351
CM: 23.455
CN: 13.541
CO: 39.500
CR: 7.691
CU: 83.348
CV: 23.001
CY: 14.170
CZ: 8.683
DE: 6.048
DJ: 72.578
DK: 15.555
DZ: 31.775
EC: 13.019
EG: 18.791
ES: 9.643
ET: 46.640
FI: 40.870
FR: 48.973
GB: 5.660
GE: 10.658
GH: 85.514
GQ: 99.999
GR: 13.514
HK: 16.645
HN: 43.333
HR: 23.090
HU: 13.856
ID: 66.646
IE: 14.068
IN: 68.162
IQ: 9.969
IR: 75.197
IS: 18.209
IT: 17.130
JM: 13.521
JO: 32.758
JP: 16.092
KE: 40.356
KG: 51.686
KM: 99.934
KR: 8.777
KW: 88.149
KZ: 46.552
LI: 5.123
LK: 69.934
LS: 70.932
LV: 30.723
MA: 30.585
MC: 7.871
ME: 18.232
MG: 50.644
MK: 13.946
MN: 36.233
MU: 21.725
MV: 5.177
MW: 98.758
MX: 11.922
MY: 52.676
NG: 99.451
NI: 51.951
NZ: 4.667
OM: 10.984
PF: 21.958
PK: 50.498
PL: 13.454
PT: 8.261
QA: 15.876
RO: 12.554
RS: 22.423
RU: 23.846
RW: 39.736
SA: 22.528
SC: 27.379
SI: 14.154
SK: 15.316
SM: 7.767
SN: 45.455
ST: 16.373
TG: 10.455
TH: 36.910
TN: 15.826
TR: 19.035
TT: 6.732
TW: 26.130
TZ: 98.330
UG: 92.443
US: 5.723
UY: 14.077
UZ: 59.382
VE: 4.700
VN: 8.577
VU: 97.689
YE: 16.667
ZA: 35.193
ZW: 22.887
default_percent_mobile_by_device_type:
scope3:
pc: 3.0
smart-speaker: 0.001
tablet: 10.0
tv: 0.001
```
### Video player characteristics
Default video player size from [GMSF 1.2](https://adnetzero.com/wp-content/uploads/2025/06/GlobalMediaSustainabilityFrameworkV1.2.pdf)
```
default_video_player_size_bytes: 350000
default_video_player_download_trigger:
web: 'impression'
app: 'impression'
ctv-bvod: 'impression'
streaming-video: 'impression'
dooh: 'play'
social: 'impression'
```
### Media size
Based on [YouTube recommendations](https://support.google.com/youtube/answer/1722171), [Wikipedia](https://en.wikipedia.org/wiki/JPEG)
```
default_image_compression_ratio: 10
default_non_primary_video_bitrate_kbps: 1200
default_video_bitrate_kbps:
phone: 800
tablet: 1000
pc: 1200
tv: 3690
default_audio_bitrate_kbps:
phone: 160
tablet: 160
pc: 160
tv: 160
smart-speaker: 160
radio: 160
```
### Device size
From common devices (Quad HD 27” monitor, iPhone 13, Nexus 5X, iPad Air 1/2, iPad 2/3, Nexus 9, 1080P TV).
**Note**: We use the software resolution, not the hardware resolution, to avoid underestimating the actual visual coverage of the ad displayed on screen.
```
default_rendered_device_height:
pc: 1080
phone: 844
tablet: 820
tv: 1080
default_rendered_device_width:
pc: 1920
phone: 390
tablet: 1180
tv: 1920
```
### Device energy use and embodied emissions
See [Consumer Devices](./consumer_devices)
```
default_device_watts:
scope3:
pc: 55.44
phone: 4.68
radio: 6.55
smart-speaker: 2.5
tablet: 5.04
tv: 136.8
sri:
phone: 2.856
pc: 29.4
tablet: 29.4
tv: 81.6
default_device_embodied_emissions_per_second:
scope3:
phone: 0.00655
pc: 0.00545
tablet: 0.0257
tv: 0.00865
smart-speaker: 0.0061
radio: 0.002514375
sri:
phone: 0.00946
pc: 0.0132
tablet: 0.0128
tv: 0.00889
default_audio_power_utilization:
pc: 0.84
phone: 0.36
tablet: 0.36
tv: 0.92
smart-speaker: 1.0
radio: 1.0
default_device_usage_emissions_from_fuel_consumption_per_second:
phone: 0
pc: 0
tablet: 0
tv: 0
smart-speaker: 0
radio: 0.005
```
### Time in view for non-video ads
Default in view time from [GMSF 1.2](https://adnetzero.com/wp-content/uploads/2025/06/GlobalMediaSustainabilityFrameworkV1.2.pdf)
```
default_time_in_view_seconds: 3
```
### Ad platform defaults
Observations from various channels and CDN / Edge Node emission factors from [GMSF 1.2](https://adnetzero.com/wp-content/uploads/2025/06/GlobalMediaSustainabilityFrameworkV1.2.pdf)
```
default_consumer_device_request_size_bytes:
web: 3000
app: 3000
ctv-bvod: 3000
dooh: 3000
audio: 3000
social: 3000
streaming-video: 3000
search: 300
default_emissions_per_creative_request_gco2_per_imp: 0.0003
default_emissions_per_bid_request_gco2_per_imp: 0.11442
default_emissions_per_rtdp_request_gco2_per_imp: 0.01
default_emissions_generic_ad_server_gco2_per_imp: 0.000016
default_emissions_generic_ad_server_gco2_per_imp_by_channel:
social: 0.0043
default_emissions_ad_selection_gco2_per_imp_by_channel:
search: 0.0012293
dooh: 0.00384
default_count_ad_platform:
search: 1
dooh: 6
generic_creative_ad_server:
emissions_per_creative_request_per_geo_gco2_per_imp:
NAMER: 0.0001
EMEA: 0.0001
JAPAC: 0.0003
LATAM: 0.0001
generic_measurement_platform:
emissions_per_creative_request_per_geo_gco2_per_imp:
NAMER: 0.0001
EMEA: 0.0001
JAPAC: 0.0003
LATAM: 0.0001
default_platform_embodied_emissions_per_bid_request_gco2e_per_imp: 0.000015
edge_node_embodied_gco2e_per_kb: 0.000000588
edge_node_use_watts_per_kb: 0.00000043
```
### Channel and device type mappings
The default ad formats for the Web and App channels are based on the [GMSF 1.2](https://adnetzero.com/wp-content/uploads/2025/06/GlobalMediaSustainabilityFrameworkV1.2.pdf) defaults for creative payload.
```
default_channel_by_device:
phone:
- social
- ctv-bvod
- digital-audio
- app
- web
- search
- streaming-video
- linear-tv
- traditional-radio
tablet:
- social
- ctv-bvod
- digital-audio
- app
- web
- search
- streaming-video
- linear-tv
- traditional-radio
pc:
- ctv-bvod
- social
- digital-audio
- web
- search
- streaming-video
- linear-tv
- traditional-radio
tv:
- linear-tv
- ctv-bvod
- digital-audio
- traditional-radio
smart-speaker:
- digital-audio
radio:
- traditional-radio
default_device_by_channel:
social: phone
ctv-bvod: tv
streaming-video: pc
digital-audio: phone
app: phone
web: pc
dooh: tv
linear-tv: tv
search: phone
traditional-radio: radio
default_platform_ad_format_identifier_by_channel:
dooh: landscape-dooh
social: 1080-1920-sponsored-post-social-phone
ctv-bvod: 15s-video-ctv-bvod-tv
streaming-video: 15s-video-streaming-video-pc
digital-audio: 30s-audio-digital-audio-phone
app: generic-gmsf-1-2-display-ad-app-phone
web: generic-gmsf-1-2-display-ad-web-pc
linear-tv: 30s-video-ctv-bvod-tv
search: generic-search-ad-search-phone
traditional-radio: 30s-radio-traditional-radio-radio
classic-ooh: 6-sheet-classic-ooh-panel
default_platform_ad_format_by_channel:
dooh: Landscape - 1920x1080 Image
social: Sponsored Post - 1080x1920 Image
ctv-bvod: 15s Video
streaming-video: 15s Video
digital-audio: 30s Audio
app: Generic GMSF 1.2 Display Ad
web: Generic GMSF 1.2 Display Ad
linear-tv: 30s Video
search: Generic Search Ad
traditional-radio: 30s Radio
classic-ooh: 6 Sheet
default_print_ad_format_by_medium:
newspaper: Quarter Page Newspaper
magazine: Full Page Magazine
leaflet: Full Page Leaflet
default_property_average_imps_per_session_by_channel:
social: 24
ctv-bvod: 18
streaming-video: 1
digital-audio: 4.8
app: 14
web: 32
linear-tv: 30
search: 12
traditional-radio: 21.5
default_property_ad_funded_percentage_by_channel:
dooh: 100
social: 100
ctv-bvod: 100
streaming-video: 100
digital-audio: 100
app: 100
web: 100
linear-tv: 100
search: 100
traditional-radio: 100
default_average_seconds_per_session_excluding_ads_by_channel:
social: 240
ctv-bvod: 2580
streaming-video: 143
digital-audio: 1500
app: 140
web: 320
linear-tv: 2580
search: 120
traditional-radio: 2580
default_average_data_kb_per_session_seconds_excluding_ads_by_channel:
social: 38
app: 29.5
web: 1.011
search: 1.011
default_property_g_per_imp_by_channel:
dooh: 0.049
social: 0.15
streaming-video: 0.049
ctv-bvod: 0.280
digital-audio: 0.049
app: 0.049
web: 0.049
search: 0.049
```
### Broadcasting defaults
```
default_percent_tv_distribution_method:
cable: 28.6
iptv: 25.2
ota: 26.2
satellite: 20
default_percent_tv_distribution_method_by_country:
AU:
cable: 9.2
iptv: 40.8
ota: 45.4
satellite: 4.6
DE:
cable: 41.5
iptv: 9.6
ota: 3.4
satellite: 45.5
FR:
cable: 0
iptv: 46
ota: 46
satellite: 8
GB:
cable: 8.9
iptv: 27.5
ota: 40.6
satellite: 23
US:
cable: 43.3
iptv: 20.7
ota: 19.3
satellite: 16.7
default_tv_signal_preparation_power_watt: 16700
default_tv_signal_transmission_power_by_tv_distribution_method_watt:
cable: 16000
ota: 165000
satellite: 3150
default_tv_signal_transmission_embodied_gco2e_per_second: 27
default_tv_home_equipment_power_by_tv_distribution_method_watt:
cable: 16
iptv: 21
ota: 1
satellite: 22
default_tv_home_equipment_embodied_gco2e_per_second_by_tv_distribution_method:
cable: 0.005346759
iptv: 0.005492307
ota: 0.001354252
satellite: 0.011423331
default_device_per_impression:
app: 1
digital-audio: 1
ctv-bvod: 1
linear-tv: 0.667
streaming-video: 1
web: 1
traditional-radio: 0.667
default_property_g_per_play_by_channel:
linear-tv: 790
traditional-radio: 790
default_iptv_network_distribution:
fixed: 0.999
mobile: 0.001
default_percent_radio_distribution_method:
fm: 60
am: 15
ota: 20
satellite: 5
default_radio_signal_transmission_power_by_radio_distribution_method_watt:
fm: 245000
am: 273000
ota: 106000
satellite: 3150
default_radio_signal_transmission_embodied_by_radio_distribution_method_gco2e_per_second:
fm: 7
am: 10
ota: 5
satellite: 6
```
### Creative storage defaults
Emission factors from [GMSF 1.2](https://adnetzero.com/wp-content/uploads/2025/06/GlobalMediaSustainabilityFrameworkV1.2.pdf), along with assumptions on average distribution per storage type, default multipliers to estimate the required storage space based on the delivered creative size and default impressions per creative.
```
default_impressions_per_creative: 1000000
default_storage_kgco2e_per_gb:
cloud_storage: 0.0253
hard_disk_drive: 0.16
linear_tape_open: 0.00114
solid_state_drive: 0.02
default_storage_usage_pct:
cloud_storage: 45
hard_disk_drive: 25
linear_tape_open: 10
solid_state_drive: 20
creative_raw_asset_size_factor_by_channel:
app: 20
ctv-bvod: 50
digital-audio: 5
dooh: 5
linear-tv: 50
search: 0
social: 20
streaming-video: 20
traditional-radio: 5
web: 20
creative_work_iterations_factor_by_channel:
app: 1
ctv-bvod: 1
digital-audio: 1
dooh: 1
linear-tv: 1
search: 1
social: 1
streaming-video: 1
traditional-radio: 1
web: 1
```
### Asset size defaults
```
default_display_other_assets_bytes: 50000
default_display_creative_overhead_factor: 0.2
```
### Classic OOH defaults
```
default_ad_landfill_emissions_kgco2e_per_sq_metre: 0.291
default_ad_pct_recycling:
classic-ooh: 20.0
default_ad_recycling_emissions_kgco2e_per_sq_metre: 0.1
default_corporate_emissions_kgco2e_per_panel_per_day: 0.3
default_embodied_emissions_kgco2e_per_sq_metre: 115.0
default_emissions_kgco2e_per_km_travelled: 0.2543
default_mechanical_rotation_power_draw_watts_per_sq_metre_per_hour: 12.5
default_digital_screen_landfill_emissions_kgco2e_per_sq_metre: 20.9
default_expected_lifetime_years: 10.0
default_illumination_power_draw_watts_per_sq_metre_per_hour: 100.0
default_ooh_ad_production_kgco2e_emissions_per_sq_metre: 3.78
default_ooh_campaign_duration_days: 14
default_ooh_share_of_time_pct: 100.0
default_panel_to_disposal_distance_per_ad_km: 4.0
default_printing_to_storage_distance_km_per_ad:
classic-ooh:
AD: 0.5
AE: 0.5
AL: 0.5
AM: 0.5
AO: 0.5
AT: 0.5
AU: 0.5
AZ: 0.5
BD: 0.5
BE: 0.5
BG: 0.5
BH: 0.5
BJ: 0.5
BR: 0.5
BS: 0.5
BT: 0.5
BW: 0.5
BY: 0.5
CA: 0.5
CH: 0.5
CI: 0.5
CL: 0.5
CM: 0.5
CN: 0.5
CO: 0.5
CR: 0.5
CU: 0.5
CV: 0.5
CY: 0.5
CZ: 0.5
DE: 0.5
DJ: 0.5
DK: 0.5
DZ: 0.5
EC: 0.5
EG: 0.5
ES: 0.5
ET: 0.5
FI: 0.5
FR: 0.5
GB: 0.5
GE: 0.5
GH: 0.5
GQ: 0.5
GR: 0.5
HK: 0.5
HN: 0.5
HR: 0.5
HU: 0.5
ID: 0.5
IE: 0.5
IN: 0.5
IQ: 0.5
IR: 0.5
IS: 0.5
IT: 0.5
JM: 0.5
JO: 0.5
JP: 0.5
KE: 0.5
KG: 0.5
KM: 0.5
KR: 0.5
KW: 0.5
KZ: 0.5
LI: 0.5
LK: 0.5
LS: 0.5
LV: 0.5
MA: 0.5
MC: 0.5
ME: 0.5
MG: 0.5
MK: 0.5
MN: 0.5
MU: 0.5
MV: 0.5
MW: 0.5
MX: 0.5
MY: 0.5
NG: 0.5
NI: 0.5
NZ: 0.5
OM: 0.5
PF: 0.5
PK: 0.5
PL: 0.5
PT: 0.5
QA: 0.5
RO: 0.5
RS: 0.5
RU: 0.5
RW: 0.5
SA: 0.5
SC: 0.5
SI: 0.5
SK: 0.5
SM: 0.5
SN: 0.5
ST: 0.5
TG: 0.5
TH: 0.5
TN: 0.5
TR: 0.5
TT: 0.5
TW: 0.5
TZ: 0.5
UG: 0.5
US: 0.5
UY: 0.5
UZ: 0.5
VE: 0.5
VN: 0.5
VU: 0.5
YE: 0.5
ZA: 0.5
ZW: 0.5
default_storage_emissions_kgco2e_per_panel: 0.01648333
default_storage_to_installation_distance_km_per_ad:
classic-ooh:
AD: 4.0
AE: 4.0
AL: 4.0
AM: 4.0
AO: 4.0
AT: 4.0
AU: 4.0
AZ: 4.0
BD: 4.0
BE: 4.0
BG: 4.0
BH: 4.0
BJ: 4.0
BR: 4.0
BS: 4.0
BT: 4.0
BW: 4.0
BY: 4.0
CA: 4.0
CH: 4.0
CI: 4.0
CL: 4.0
CM: 4.0
CN: 4.0
CO: 4.0
CR: 4.0
CU: 4.0
CV: 4.0
CY: 4.0
CZ: 4.0
DE: 4.0
DJ: 4.0
DK: 4.0
DZ: 4.0
EC: 4.0
EG: 4.0
ES: 4.0
ET: 4.0
FI: 4.0
FR: 4.0
GB: 4.0
GE: 4.0
GH: 4.0
GQ: 4.0
GR: 4.0
HK: 4.0
HN: 4.0
HR: 4.0
HU: 4.0
ID: 4.0
IE: 4.0
IN: 4.0
IQ: 4.0
IR: 4.0
IS: 4.0
IT: 4.0
JM: 4.0
JO: 4.0
JP: 4.0
KE: 4.0
KG: 4.0
KM: 4.0
KR: 4.0
KW: 4.0
KZ: 4.0
LI: 4.0
LK: 4.0
LS: 4.0
LV: 4.0
MA: 4.0
MC: 4.0
ME: 4.0
MG: 4.0
MK: 4.0
MN: 4.0
MU: 4.0
MV: 4.0
MW: 4.0
MX: 4.0
MY: 4.0
NG: 4.0
NI: 4.0
NZ: 4.0
OM: 4.0
PF: 4.0
PK: 4.0
PL: 4.0
PT: 4.0
QA: 4.0
RO: 4.0
RS: 4.0
RU: 4.0
RW: 4.0
SA: 4.0
SC: 4.0
SI: 4.0
SK: 4.0
SM: 4.0
SN: 4.0
ST: 4.0
TG: 4.0
TH: 4.0
TN: 4.0
TR: 4.0
TT: 4.0
TW: 4.0
TZ: 4.0
UG: 4.0
US: 4.0
UY: 4.0
UZ: 4.0
VE: 4.0
VN: 4.0
VU: 4.0
YE: 4.0
ZA: 4.0
ZW: 4.0
default_structure_expected_lifetime_years: 10.0
default_structure_landfill_emissions_kgco2e_per_sq_metre: 2.2
default_structure_pct_recycling:
classic-ooh: 58.75
default_structure_recycling_emissions_kgco2e_per_sq_metre: 0.0
```
### Print defaults
```
default_downstream_transport_emissions_kgco2e_tonne_transported_per_km: 0.6382
default_downstream_travelled_distance_km: 100.0
default_freight_transport_emissions_kgco2e_tonne_transported_per_km: 0.11
default_papermill_to_printer_distance_km: 500.0
default_print_avg_readership:
newspaper: 2.0
magazine: 5.0
leaflet: 0.5
default_print_media_corporate_emissions_per_page_gco2e: 0.05
default_print_medium_ad_to_edit_ratio:
newspaper: 0.40
magazine: 0.50
leaflet: 1.0
default_print_medium_incineration_emission_factor_kgco2e_per_kg: 0.00641
default_print_medium_landfill_emission_factor_kgco2e_per_kg: 1.16
default_print_medium_page_surface_sq_meter:
newspaper: 0.228
magazine: 0.062
leaflet: 0.031
default_print_medium_paper_gsm:
newspaper: 45
magazine: 90
leaflet: 90
default_print_medium_paper_production_emissions_gco2e_gram: 0.001345
default_print_medium_reader_incineration_percentage: 15.0
default_print_medium_reader_incineration_percentage_by_country:
GB: 17.0
FR: 25.0
DE: 13.0
NL: 13.0
ES: 20.0
IT: 16.0
US: 8.0
CA: 10.0
AU: 12.0
JP: 17.0
CN: 15.0
IN: 10.0
default_print_medium_reader_landfill_percentage: 20.0
default_print_medium_reader_landfill_percentage_by_country:
GB: 5.0
FR: 5.0
DE: 2.0
NL: 1.0
ES: 7.0
IT: 5.0
US: 24.0
CA: 20.0
AU: 10.0
JP: 1.0
CN: 35.0
IN: 60.0
default_print_medium_reader_recycling_percentage: 65.0
default_print_medium_reader_recycling_percentage_by_country:
GB: 78.0
FR: 70.0
DE: 85.0
NL: 86.0
ES: 73.0
IT: 79.0
US: 68.0
CA: 70.0
AU: 78.0
JP: 82.0
CN: 50.0
IN: 30.0
default_print_medium_recycling_emission_factor_kgco2e_per_kg: 0.00641
default_print_medium_total_pages:
newspaper: 40
magazine: 100
leaflet: 1
default_print_medium_unsold_incineration_percentage: 15.0
default_print_medium_unsold_landfill_percentage: 5.0
default_print_medium_unsold_recycling_percentage: 80.0
default_print_sellthrough_rate_pct:
newspaper: 80.0
magazine: 65.0
leaflet: 100.0
default_print_spoilage_waste_rate:
newspaper: 0.05
magazine: 0.05
default_printing_finishing_emissions_gco2e_per_page:
newspaper: 1.0
magazine: 1.5
leaflet: 2.0
default_printer_to_storage_distance_km: 100.0
```
### DOOH defaults
```
default_digital_screen_embodied_emissions_kgco2e_per_second: 0.0000249
```
## Lookups from external sources
### Carbon intensity by country, region, and UTC Date/Time
Providers should clearly and publicly document:
* Which data provider is used for carbon intensity data (for instance, WattTime or ElectricityMaps)
* What carbon intensity metric is used (marginal vs average)
`lookup_carbon_intensity_gco2e_per_kwh(country, region, utc_datetime)` should look up the carbon intensity in gCO2e based on 100-year global warming potential (GWP100) from a database at no less than hourly granularity.
`lookup_carbon_intensity_quality(country, region)` should return the quality of the underlying grid mix data on a scale of 1-5 per [Model Quality](#model-quality).
## Fallbacks
We use all data we have available on every single request but in many situations we may lack some information, for this
we have a series of fallbacks to be able to provide reasonable estimates in most situations.
To determine network when it's not submitted we calculate costs associated to network type
as a weighted average of the fixed and mobile usage in the country (if available) or worldwide.
We can also generally determine the channel from the property or when that is ambiguous but we have device information
we fall back to a default channel by device.
```
pct_mobile =
country ?
default_percent_mobile_by_country[country] / 100 :
default_percent_mobile / 100
average_embodied_emissions_gco2e_per_kb =
default_network_embodied_emissions_gco2e_per_kb['mobile'] x pct_mobile +
default_network_embodied_emissions_gco2e_per_kb['fixed'] x (1 - pct_mobile)
embodied_emissions_gco2e_per_kb =
network_type ?
default_network_embodied_emissions_gco2e_per_kb[network_type] :
average_embodied_emissions_gco2e_per_kb
average_usage_kwh_per_gb =
default_usage_kwh_per_gb['mobile'] x pct_mobile +
default_usage_kwh_per_gb['fixed'] x (1 - pct_mobile)
usage_kwh_per_gb =
network_type ?
default_usage_kwh_per_gb['network_type'] :
average_usage_kwh_per_gb
average_baseload_watts =
default_baseload_watts['mobile'] x pct_mobile +
default_baseload_watts['fixed'] x (1 - pct_mobile)
average_dynamic_watts_per_mbps =
default_dynamic_watts_per_mbps['mobile'] x pct_mobile +
default_dynamic_watts_per_mbps['fixed'] x (1 - pct_mobile)
baseload_watts =
network_type ?
default_baseload_watts[network_type] :
average_baseload_watts
dynamic_watts_per_mbps =
network_type ?
default_dynamic_watts_per_mbps[network_type] :
average_dynamic_watts_per_mbps
lookup_channel:
if property.channels.length == 1:
return property.channels[0]
if channel && channel in property.channels:
return channel
is_audio_creative =
creative_audio_data_transfer_bytes ||
creative_audio_duration_seconds ||
ad_format.audio_duration_seconds
if is_audio_creative && 'audio' in property.channels:
return 'audio'
if device_type && default_channel_by_device[device_type] in property.channels:
return default_channel_by_device[device_type]
return property.channels[0]
channel = lookup_channel()
device_type = device_type ? default_device_by_channel[channel]
```
## Calculating Emissions
### Tech Manipulation - Creative Storage
```
creative_storage_gco2_per_imp =
(default_linear_tape_open_storage_kgco2e_per_gb * default_linear_tape_open_storage_usage_pct
+ default_hard_disk_drive_storage_kgco2e_per_gb * default_hard_disk_drive_storage_usage_pct
+ default_solid_state_drive_storage_kgco2e_per_gb * default_solid_state_drive_storage_kgco2e_per_gb
+ default_cloud_storage_kgco2e_per_gb * default_cloud_storage_usage_pct)
* 1000
* ((creative_data_transfer_bytes * creative_raw_asset_size_factor[Channel] + creative_data_transfer_bytes * creative_work_iterations_factor[Channel]) / 1000000000)
/ default_impressions_per_creative
```
### Creative Delivery - Data Transfer
```
creative_data_transfer_emissions_gco2_per_imp =
creative_data_transfer_usage_emissions_gco2_per_imp +
creative_data_transfer_embodied_emissions_gco2_per_imp
```
For all channels other than CTV/BVOD, use the conventional model:
```
creative_data_transfer_bytes =
video_bytes +
audio_bytes +
image_bytes +
ad_format.video_player.size_bytes +
ad_format.other_asset_bytes
creative_data_transfer_usage_emissions_gco2 =
creative_data_transfer_bytes / 1000 x
usage_kwh_per_gb / 1000000 x
lookup_carbon_intensity_gco2e_per_kwh(country, region, utc_datetime)
creative_data_transfer_embodied_emissions_gco2 =
creative_data_transfer_bytes / 1000 x
embodied_emissions_gco2e_per_kb
```
If data transfer is provided in the delivery row, use it:
```
image_bytes = creative_total_image_data_transfer_bytes
video_bytes = creative_total_video_data_transfer_bytes + (creative_video_vast_bytes x loads)
audio_bytes = creative_total_audio_data_transfer_bytes
```
Otherwise, calculate data transfer:
```
image_sizes = creative_image_sizes ? ad_format.image_sizes
image_bytes = SUM(image_sizes[n].width x image_sizes[n].height) x 3 / default_image_compression_ratio x impressions
audio_duration = creative_audio_duration_seconds ?? ad_format.audio_duration_seconds
audio_bytes = audio_duration_seconds x default_audio_bitrate_kbps[device_type] / 8 x 1000 x impressions
is_primary_experience = !ad_format.rendered_width_pixels && !ad_format.rendered_height_pixels
default_bitrate_kbps =
is_primary_experience ?
default_video_bitrate_kbps[device_type] :
default_non_primary_video_bitrate_kbps
video_bitrate_kbps =
creative_video_bitrate_kbps ??
creative_video_size_bytes x 8 / 1000 / creative_video_duration ??
property.video_bitrate_kbps[device_type] ??
default_bitrate_kbps
video_duration = creative_video_duration_seconds ?? ad_format.video_duration_seconds
seconds_watched = creative_video_view_time_seconds ??
creative_video_view_rate x video_duration_seconds ??
video_duration_seconds
buffer = ad_format.video_player.buffering_seconds ?? infinity
seconds_streamed = MIN(seconds_watched + buffer, video_duration_seconds)
loads = switch(ad_format.video_player.download_trigger):
'view': views
'play': plays
'impression': impressions
video_bytes = (video_bitrate_kbps / 8 x 1000 x seconds_streamed + creative_video_vast_bytes) x loads
```
For CTV/BVOD, use the power model:
```
video_bitrate_kbps =
creative_video_bitrate_kbps ??
property.video_bitrate_kbps[device_type] ??
default_video_bitrate_kbps[device_type]
power_watts =
baseload_watts +
dynamic_watts_per_mbps x video_bitrate_kbps / 1000
creative_data_transfer_usage_emissions_gco2_per_imp =
creative_video_duration_seconds / 3600 x
power_watts / 1000 x
lookup_carbon_intensity_gco2e_per_kwh(country, region, utc_datetime)
creative_data_transfer_embodied_emissions_gco2_per_imp =
creative_video_duration_seconds x
video_bitrate_kbps / 128 x
embodied_emissions_gco2e_per_kb
```
### Creative Delivery - Platform
```
default_creative_platforms =
creative_is_3p_served ?
[generic_creative_ad_server, generic_measurement_platform] :
[]
creative_platforms = creative_ad_platforms ?? default_creative_platforms
creative_platform_emissions_gco2_per_imp = 0
for platform in [creative_platforms, ad_format.ad_platforms]:
emissions_per_creative_request_per_geo_gco2_per_imp =
platform.emissions_per_creative_request_per_geo_gco2_per_imp ??
((creative_data_transfer_bytes / 1000) x
(edge_node_use_watts_per_kb / 1000) x
lookup_carbon_intensity_gco2e_per_kwh(country, region, utc_datetime))
+
(creative_data_transfer_bytes / 1000 x
edge_node_embodied_gco2e_per_kb)
creative_platform_emissions_gco2_per_imp += emissions_per_creative_request_per_geo_gco2_per_imp
```
### Creative Delivery - Consumer Device
```
device_pixels = default_rendered_device_width[device_type] x default_rendered_device_height[device_type]
rendered_width = ad_format.rendered_width_pixels ?? default_rendered_device_width[device_type]
rendered_height = ad_format.rendered_height_pixels ?? default_rendered_device_height[device_type]
visual_device_coverage =
is_primary_experience ?
1 :
MIN(1, rendered_width x rendered_height / device_pixels)
time_in_view =
video_duration ??
creative_time_in_view_seconds ??
default_time_in_view_seconds
if channel == digital-audio :
device_power_utilization == 'smart-speaker' ? 1 : default_audio_power_utilization[device_type]
energy_adjusted_active_seconds = device_power_utilization * audio_duration
else:
energy_adjusted_active_seconds = visual_device_coverage x time_in_view
creative_consumer_device_usage_emissions_gco2_per_imp =
device_coverage_seconds / 3600 x
default_device_watts[device_type] / 1000 x
lookup_carbon_intensity_gco2e_per_kwh(country, region, utc_datetime)
+ default_device_usage_emissions_from_fuel_consumption_per_second[device_type]
creative_consumer_device_embodied_emissions_gco2_per_imp =
device_coverage_seconds x
default_device_embodied_emissions_per_second[device_type]
```
### Media Delivery - Data Transfer
```
media_data_transfer_emissions_gco2_per_imp =
media_data_transfer_usage_emissions_gco2_per_imp +
media_data_transfer_embodied_emissions_gco2_per_imp
```
Determing the session seconds for a single impressions
```
session_seconds_per_imp =
property.average_seconds_per_session_excluding_ads x
property.ad_funded_percentage/100 /
property.average_imps_per_session
```
For all channels other than CTV/BVOD, use the conventional model:
```
media_data_transfer_kb_per_imp =
property.average_data_kb_per_session_excluding_ads x
property.ad_funded_percentage/100 /
property.average_imps_per_session
media_data_transfer_usage_emissions_gco2_per_imp =
media_data_transfer_kb_per_imp x
usage_kwh_per_gb / 1000000 x
lookup_carbon_intensity_gco2e_per_kwh(country, region, utc_datetime)
media_data_transfer_embodied_emissions_gco2_per_imp =
media_data_transfer_kb_per_imp x
embodied_emissions_gco2e_per_kb
```
For CTV/BVOD, use the power model:
```
video_bitrate_kbps = property.video_bitrate_kbps[device_type] ?? default_video_bitrate_kbps[device_type]
power_watts =
baseload_watts +
dynamic_watts_per_mbps x video_bitrate_kbps / 1000
media_data_transfer_usage_emissions_gco2_per_imp =
session_seconds_per_imp / 3600 x
power_watts / 1000 x
lookup_carbon_intensity_gco2e_per_kwh(country, region, utc_datetime)
media_data_transfer_embodied_emissions_gco2_per_imp =
session_seconds_per_imp x
video_bitrate_kbps / 128 x
embodied_emissions_gco2e_per_kb
```
### Media Delivery - Consumer Device
```
media_consumer_device_usage_emissions_gco2_per_imp =
session_seconds_per_imp / 3600 x
default_device_watts[device_type] / 1000 x
lookup_carbon_intensity_gco2e_per_kwh(country, region, utc_datetime)
+ default_device_usage_emissions_from_fuel_consumption_per_second[device_type]
media_consumer_device_embodied_emissions_gco2_per_imp =
session_seconds_per_imp x
default_device_embodied_emissions_per_second[device_type]
```
### Media Delivery - Corporate
```
media_corporate_emissions_gco2_per_imp =
property.allocated_adjusted_corporate_emissions_kg x 1000 /
property.total_sessions /
property.average_imps_per_session
```
### Ad Selection - Platform
```
get_platform_emissions(ad_platform):
direct_emissions = usage_emissions_per_bid_request_per_geo_gco2_per_imp + default_platform_embodied_emissions_per_bid_request_gco2e_per_imp
rtdp_emissions = 0
for rtdp in ad_platform.real_time_data_providers:
rtdp_emissions += usage_emissions_per_rtdp_request_per_geo_gco2_per_imp + default_platform_embodied_emissions_per_bid_request_gco2e_per_imp
bidder_emissions = 0
for bidder in ad_platform.bidders:
bidder_emissions += get_platform_emissions(bidder) x
ad_platform.distribution_rate_by_bidder_by_country[country, bidder] ?? 1
return direct_emissions + rtdp_emissions + bidder_emissions
ad_selection_platform_emissions_gco2_per_imp = 0
data_transfer_bytes = 0
if channel in ['search', 'dooh']:
data_transfer_bytes = default_count_ad_platform[channel] * default_consumer_device_request_size_bytes[channel]
ad_selection_platform_emissions_gco2_per_imp = default_emissions_ad_selection_gco2_per_imp_by_channel[channel]
else:
for platform in placement.ad_platforms:
ad_selection_platform_emissions_gco2_per_imp += get_platform_emissions(platform)
platform_bytes =
platform.average_bid_request_size ??
default_consumer_device_request_size_bytes[channel]
data_transfer_bytes += default_consumer_device_request_size_bytes[channel]
if platform.sends_client_side_requests:
for bidder in platform.bidders:
bidder_bytes =
bidder.average_bid_request_size ??
default_consumer_device_request_size_bytes[channel]
data_transfer_bytes +=
bidder_bytes x
platform.distribution_rate_by_bidder_by_country[country, bidder] ?? 1
```
### Ad Selection - Data Transfer
```
ad_selection_data_transfer_usage_emissions_gco2_per_imp =
data_transfer_bytes / 1000 x
usage_kwh_per_gb / 1000000 x
lookup_carbon_intensity_gco2e_per_kwh(country, region, utc_datetime)
ad_selection_data_transfer_embodied_emissions_gco2_per_imp =
data_transfer_bytes / 1000 x
embodied_emissions_gco2e_per_kb
ad_selection_data_transfer_emissions_gco2_per_imp =
ad_selection_data_transfer_usage_emissions_gco2_per_imp +
ad_selection_data_transfer_embodied_emissions_gco2_per_imp
```
### Model Quality
```
grid_mix_model_quality = lookup_carbon_intensity_quality(country, region)
organization_model_quality = property.organization_model_quality
property_model_quality = property.model_quality
total_platforms = 0
modeled_platforms = 0
for platform in placement.ad_platforms:
total_platforms++
if platform.model_quality > 1
modeled_platforms++
# Model one level of downstream platforms
for bidder in ad_platform.bidders:
total_platforms++
if bidder.model_quality > 1
modeled_platforms++
ad_platform_modeled_ratio = modeled_platforms / total_platforms
```
# Channel Considerations
Source: https://methodology.scope3.com/channel_considerations
# Channel-Specific Modeling Considerations
Different advertising channels require specific modeling approaches due to their unique infrastructure, operational characteristics, and consumption patterns. This document details the methodology considerations for Linear TV, Traditional Radio, Digital Out-of-Home (DOOH), and Classic Out-of-Home (OOH). While these channels share some common principles, each has distinct lifecycle boundaries, data requirements, and default assumptions that reflect the nature of their delivery and usage.
# Linear TV
## Definition and Scope
We classify Linear TV as content that is transmitted via traditional broadcast methods and follows a predetermined programming schedule.
### Glossary
| Term | Definition |
| ----------------- | ---------------------------------------------------------------------------------------------------------- |
| TV Network | The organization or company responsible for distributing TV content (e.g., BBC, NBC, Canal+). |
| TV Channel | A specific frequency within a TV network (e.g., BBC One, ESPN2).. |
| Broadcast Method | The type of infrastructure used to transmit Linear TV content (e.g., OTA/DTT, Cable, Satellite, IPTV). |
| Co-viewing Factor | An average number of viewers per TV device, used to estimate device-level reach from audience impressions. |
### Definition of Broadcast methods
| Broadcast method | Equipment involved |
| --------------------------------------------------------- | ----------------------------------------------------------------------------------------------------------- |
| Over-the-air (OTA) & Digital Terrestrial Television (DTT) | Transmitting towers, repeaters, household antennas… |
| Cable | Same as the Internet network (infrastructure is typically shared across telephone, television and Internet) |
| Satellite | Transmitting Satellite dishes, Satellite, Receiving satellite dishes, set top boxes |
| IPTV (Internet Protocol Television) | Internet network, set top boxes |
## Boundaries of Measurement
The Scope3 Linear TV model focuses on estimating emissions coming from the distribution (broadcasting) and consumer viewing of television content and advertising.
| Lifecycle Category | Emissions Source | Status | Includes |
| -------------------------------- | ------------------------------------------------------ | ------------ | ----------------------------------------------------------------------------------------------------------------------------------------------------------------------- |
| Media Production | Content production | Not Included | |
| Creative Production | Ad production | Not included | |
| Media Distribution | Corporate emissions from TV network | Included | |
| Media & Creative Distribution | Broadcast Signal preparation, transmission & reception | Included | Encoding & multiplexing
OTA/DTT, cable, Satellite & IPTV networks (use phase & embodied)
Household Equipment used for signal reception (use phase & embodied) |
| Media & Creative Consumer Device | TV viewing | Included | Television device (use phase & embodied) |
## Emissions Calculation Methodology
### Corporate Emissions
For Linear TV, we estimate corporate emissions per TV spot rather than per audience or household impression. We do this to avoid having differing numbers depending on fluctuating TV ratings.
All other aspects of our calculations for corporate emissions remain as described in [Corporate Emissions](./corporate_model).
### Broadcast Signal Emissions
#### Encoding & Multiplexing
In [*A comparison of the carbon footprint of digital terrestrial television with video-on-demand*](https://downloads.bbc.co.uk/rd/pubs/whp/whp-pdf-files/WHP189.pdf) the BBC estimated that their encoding & multiplexing facility required a power draw of 400kW to encode TV content for their 24 channels.
We use this estimate to derive that it takes an average power draw of 16.7kW to encode and multiplex TV content for one channel (no matter the number of viewing households). For TV networks and/or channels where actual power usage data is available, we use those values instead of the average.
#### Signal Transmission
##### Energy Use
For each TV broadcast method we consider a fixed energy consumption required to broadcast the signal no matter the number of viewing households.
Different TV broadcast methods have varying power efficiency in different countries but for now we do not differentiate between countries.
For each TV broadcast method we have derived power draw estimates from annual energy consumption, either from primary sourced energy consumption data shared with Scope3 by network operators or from the BBC paper.
| TV Broadcast Method | Energy consuming sources | Required Power for signal transmission of 1 TV channel | Source(s) | Assumptions |
| ------------------- | ------------------------------------------------------ | ------------------------------------------------------ | ----------------------------- | ----------------------------------------------------------------------------------------------------------------------------------------------------------------------------------------------- |
| OTA/DTT | Over the air transmission network | 165 kW | Terrestrial Network operators | - National distribution |
| Cable | Cable network | 16 kW | BBC paper | - TV represents 53% of cable network usage
- The Virgin Media cable network provider in the UK hosts 400 channels. |
| Satellite | Uplink transmission from TV station tower to satellite | 3.15kW | BBC paper | - No emissions coming from downlink transmission from space satellite to household dishes (satellites being powered by the sun)
- Assuming equal energy usage across all BBC's 24 channels |
Once again, for TV networks and/or channels where actual power usage data is available, we use those values instead of the above defaults.
##### Embodied Emissions
In the absence of data specific to each TV broadcast method, we utilize our estimates of the embodied emissions as the fixed Internet network (0.00000443 gCO2e per kb) to derive the embodied emissions of each broadcast method per second, assuming 6Mbps per transmitter per channel, across 1000 transmitters.
```equation theme={null}
embodied_emissions_gco2e_per_second = 0.00000443 gCO2e/kb * 1000 transmitters * 6000 kbps/channel = 27 gCO2e/second/channel
```
#### Broadcast Method Usage
The prevalence of each TV broadcast method varies by TV network and geographically. For example, in France OTA/DTT and IPTV are the most widely used broadcast methods in terms of households, whereas in Germany satellite is the most prevalent method. We apply a country-specific ratio of broadcast methods for major markets, and use a global average for other countries.
| Country | % of households using OTA/DTT | % of households using cable | % of households using satellite | % of households using IPTV |
| --------------- | ----------------------------- | --------------------------- | ------------------------------- | -------------------------- |
| Global Defaults | 26% | 29% | 20% | 25% |
| USA | 19% | 43% | 17% | 21% |
| UK | 41% | 9% | 23% | 27% |
| France | 46% | 0% | 8% | 46% |
| Germany | 3% | 42% | 46% | 9% |
| Australia | 48% | 0% | 8% | 44% |
### Household Equipment Emissions
#### Energy Consumption
We consider some household equipment "passive", meaning that they do not require any power to receive the broadcast signal, and others "active".
| Component | Broadcasting Method(s) | Global % of household with that equipment for that broadcast method | Active or Passive | Estimated Power Draw | Source(s) |
| ----------------------------------- | ----------------------- | ------------------------------------------------------------------- | ----------------- | -------------------- | ---------------------------------------------------- |
| Household antena | OTA/DTT | 100% | Passive | 0W | - |
| Satellite dish | Satellite | 100% | Passive | 0W | - |
| Low-Noise Block Downconverter (LNB) | Satellite | 100% | Active | 5W | Average across various manufacturers' specifications |
| Signal Amplifier | OTA/DTT & Satellite | 20% | Active | 5W | BBC paper |
| Decoder / STB | Cable, Satellite & IPTV | 100% | Active | 16W | BBC paper |
| Co-axial cable | Cable & IPTV | 100% | Passive | 0W | - |
| Home router | IPTV | 100% | Active | 5W | See [Data Transfer](./data_transfer) |
#### Embodied Emissions
Similarly to how we model consumer devices (see [Consumer Devices](./consumer_devices)), we estimate *Production Energy per Use Second* (PEPS) for each and every piece of household equipment.
| Component | Broadcasting Method(s) | Global % of household with that equipment for that broadcast method | Equipment use Allocation % for Linear TV | Lifetime Impact kgCO2e (excluding use) | Usage (h/day) | Years in use | PEPS (gCO2e/s) | Mass (grams) | Example Unit |
| ----------------------------------- | ----------------------- | ------------------------------------------------------------------- | ---------------------------------------- | -------------------------------------- | ------------- | ------------ | -------------- | ------------ | -------------------------------------------- |
| Household antena | OTA/DTT | 100% | 100% | 127 | 3.9 | 20 | 0.001239121 | 860 | Clearstream 2MAX HDTV Antenna |
| Satellite dish | Satellite | 100% | 100% | 592 | 3.9 | 20 | 0.005776061 | 4000 | Cahors SMC65 White Fibreglass Satellite Dish |
| Low-Noise Block Downconverter (LNB) | Satellite | 100% | 100% | 37 | 3.9 | 20 | 0.000361004 | 250 | Universal 0.1dB Satellite LNB |
| Signal Amplifier | OTA/DTT & Satellite | 20% | 100% | 59 | 3.9 | 20 | 0.000115131 | 400 | Antenna Signal Amplifier |
| Decoder / STB | Cable, Satellite & IPTV | 100% | 100% | 265 | 3.9 | 20 | 0.005171135 | 1790 | Technisat Technicorder ISIO SC |
| Co-axial cable | Cable & IPTV | 100% | 100% | 18 | 3.9 | 20 | 0.000175623 | 120 | CIMPLE CO Coaxial Cable |
| Home router | IPTV | 100% | 50% | 45.9 | 24 | 5 | 0.000145548 | 310 | Fritz!Box 7530 |
#### Summary
| Broadcast Method | Variable Power per viewing device | PEPs (gCO2e/s) |
| ---------------- | --------------------------------- | -------------- |
| OTA/DTT | 1W | 0.00135 |
| Cable | 16W | 0.00535 |
| Satellite | 22W | 0.0114 |
| IPTV | 21W | 0.00549 |
### TV Viewing Emissions
We follow the same methodology as described in [Consumer Devices](./consumer_devices), accounting for both use phase (energy consumption) and embodied emission (production & disposal), aligned with GMSF 1.2:
| Device | Power (W) | PEPS (gCO2e/s) |
| --------------------- | --------- | -------------- |
| TV System (Linear TV) | 136.8 | 0.00865 |
### Estimating the number of TV impressions
We estimate the number of TV devices reached using a co-viewing factor of 1.5, in line with published audience measurement benchmarks across major markets. This means that for every 1.5 audience impressions, we assume one TV device was used to view the content.
Example:
* Input: 1,000,000 audience impressions for a TV spot
* Device count estimate: 1,000,000 ÷ 1.5 = 666,667 TV devices
# Digital Out-of-Home (DOOH)
## Definition and Scope
Digital Out-of-Home (DOOH) refers to digital displays used for advertising in public spaces, such as billboards, transit displays, and retail screens. Unlike Linear TV, DOOH screens are owned or leased by media owners who have direct control over their operation and maintenance.
## Boundaries of Measurement
DOOH screens, like consumer devices, require energy to display an ad. Energy consumption during the use phase is in fact the highest source of emissions.
However, on the contrary to consumer devices, billboards are owned or leased by media owners who therefore have a high level of operational control over the screen attributes that influence embodied and energy related emissions (venue category, manufacturer, model, size, location and positioning, operating hours, brightness settings etc...). For that reason, we are including emissions from screens' energy usage and production to "media distribution".
| Emissions source | Lifecycle category | Status |
| --------------------------- | --------------------- | ---------------- |
| Screens' embodied emissions | Media Distribution | In-development |
| Screens' energy consumption | Media Distribution | Included |
| Corporate emissions | Media Distribution | Included |
| Use of Ad Technology | Ad Selection | In-development |
| Creative data transfers | Creative Distribution | Included |
| Screens' recycling/disposal | Disposal | To be considered |
## Emissions Calculation Methodology
### Screen Emissions
#### Embodied Emissions
Coming soon
#### Energy Consumption
On the contrary to [consumer device emissions](./consumer_devices), we have found no credible research paper describing the power draw of large digital billboards. As such, we estimate for individual screens based on a variety of input data sources (listed in order from most accurate to least accurate):
* Electricity metres installed on the screens themselves and monitoring power draw in near real-time.
* Power bills received by media owners on a monthly, quaterly or yearly basis, for a group of or for individual screens.
* Technical specifications from screen manufacturers like Daktronics, Samsung or Panasonic. We have found that these often document maximum power draw (instead of average power draw), which can lead to an over-estimation of energy consumption.
* Extrapolation based on physical dimensions and one of the above data point for screens from the same media owner.
* Extrapolation based on physical dimensions and venue type, off the back of data for 500k+ screens kindly provided to us by early partners (including DOOH programmatic platform Hivestack and DOOH media owners JCDecaux ANZ, Go Media and Lumo).
When no screen attribute or energy data is available to us for a given screen, we estimate the power draw of that screen to be "the 80th percentile" amongst screens that media owner and/or venue category and/or country (based on statistical relevance). This approach aims to incentivize more media owners to share power draw data with us and the wider advertising industry.
### Corporate Emissions
See [Corporate Emissions](./corporate_model)
### Ad Selection Emissions
Unlike other digital channels, DOOH lacks a standard such as ads.txt that enables media owners to disclose the vendors involved in their monetization waterfall. This makes [mapping the ad tech graph](./publisher_model#mapping-the-ad-tech-graph) more challenging.
We encourage DOOH media owners to share this information with us via [Ad Stack Declaration](https://docs.scope3.com/docs/ad-stack-declaration). Where no declared data is available, and after consultation with the media owner, we assume the presence of one ad server and five SSPs called by that ad server for each ad request.
### Creative Data Transfer Emissions
See [Emissions from Data Transfer](./data_transfer)
## Additional Considerations
### Impression Multiplier
One key difference between the digital out-of-home channel and others is its one-to-many nature, meaning that most likely one ad play can be viewed by multiple individuals around the screen.
For this reason, our modelling is done "per play" and translated to "per impression" through the use of a screen specific average impression multiplier provided by partners (media owners and platforms).
When no impression multiplier data is provided to us for a given screen, we once again estimate that value to be the 80th percentile amongst screens that media owner and/or venue category and/or country (based on statistical relevance).
# Classic Out-Of-Home
## Definition and Scope
Classic OOH includes outdoor advertising displayed on non-digital panels such as posters, billboards, and transit wraps. Unlike DOOH, these formats rely on physical assets printed on paper, vinyl, or similar materials and mounted on a fixed structure. This category excludes print media such as magazines or newspapers. In our data model, the primary object representing inventory is the panel (sometimes called a “frame” in certain markets), which describes the physical structure where ads are displayed. For this channel, emissions come from tangible processes like material extraction, printing, transportation, installation, and disposal — introducing lifecycle considerations unique to physical media..
Transient OOH advertising - displayed on moving vehicles such as buses, taxis, or trains — is also covered under this model when the vehicle’s primary purpose is not advertising.
## Measurement Boundaries & GMSF Alignment
Our classic OOH model aligns closely with the Global Media Sustainability Framework (GMSF) and introduces lifecycle categories that reflect the physical nature of this channel. Unlike digital media, classic OOH requires consideration of ad production, logistics, and end-of-life treatment of physical assets.
The model aligns with GMSF and covers the following categories:
| Emissions source | Description |
| ------------------- | -------------------------------------------------------------------------------------------------------------------------------- |
| Display structure | Amortized emissions from manufacturing the supporting structure over its expected lifetime. |
| Creation | Emissions from printing the advertisement and, where relevant, producing materials used for display. |
| Distribution | Transportation and storage of physical assets prior to installation. |
| Operations | Energy consumption for illumination and mechanical rotation during the display period. |
| Disposal | Emissions from transporting and processing ad materials and structures at the end of their use, including recycling or landfill. |
| Corporate emissions | Corporate emissions from the media owner. |
## Emissions Calculation Methodology
Emissions for classic OOH are calculated using a combination of panel-level data (when available) and venue-type or country-level averages as fallback. We allocate emissions across lifecycle categories using campaign duration and share of time on each panel. Where detailed attributes such as size, illumination, or transportation distances are provided, calculations are more precise.
### Panel Object
To support granular measurement, classic OOH introduces a panel object (similar to the “screen” object used for DOOH). A panel represents the physical structure where ads are displayed and carries attributes relevant for emissions estimation:
| Attributes | Description |
| ------------------------------------------ | -------------------------------------------------------------------------------------------------- |
| Panel Identifier | Identifier of the panel, provided by the media owner |
| Media Owner | Name of the organization that owns the panel |
| Country / Region / Postcode | Location of the panel. |
| Physical Width / Physical Height | Dimensions of the panel in centimeters. |
| Average Daily Contacts | Average number of people exposed to the ad per day (if available). |
| Expected Lifetime Years | Expected lifetime of the panel for amortizing embodied emissions. |
| Average Daily Illumination Hours | Average daily hours of illumination. |
| Illumination Power Draw | Power draw (in watts) for illumination. |
| Energy Consumption Per Mechanical Rotation | Energy required for a single mechanical rotation (if applicable). |
| Mechanical Rotations Per Day | Average number of rotations per day (if applicable). |
| Average Structure Production Emissions | Total embodied emissions of the display structure (if available), excluding end of life emissions. |
| Average Ad Production Emissions | Emissions from ad asset production (if printed by media owner). |
| Recycling Percentage of Structure | Percentage of the structure expected to be recycled at end of life. |
| Recycling Percentage of Ad | Percentage of the ad expected to be recycled at end of life. |
| Distance Attributes | Distances for logistics: printing → storage, storage → panel, panel → disposal. |
The accuracy of emissions estimates for classic OOH depends on the granularity of data provided. The most precise results come from panel-level data shared by media owners, including physical dimensions, energy use, and distances for installation and disposal. Where this information is not available, we apply venue-type and country-level averages derived from industry benchmarks and Scope3 research.
If panel-level data is unavailable, we apply venue-type averages by country, then global defaults. These defaults evolve as more partners share verified data.
### Possible Improvements
This is the first version of our classic OOH emissions model, and we expect it to evolve as better data and industry standards emerge. Key areas of focus for future iterations could include:
* Refined recycling modeling: incorporating more accurate data on recycling rates and emissions from different end-of-life scenarios for both ad materials and structures.
* Material-specific defaults: differentiating production and disposal impacts based on material type (e.g., paper vs. vinyl).
* Transport mode-specific defaults: Accounting for the type of vehicles used during installation and disposal logistics, including differences between electric, hybrid, and fuel-powered fleets.
* Regionalized defaults: applying localized emission factors for printing, storage, and disposal processes, reflecting regional infrastructure and grid intensity.
* Integration with industry data: leveraging data shared by media owners and OOH associations to replace assumptions with verified inputs.
# Print
## Definition and Scope
Print encompasses print publications (newspapers and magazines), direct mail, and door drops. These formats rely on physical assets printed on paper, vinyl, or similar materials.
## Boundaries of Measurement
The Scope3 print model estimates emissions from the physical production, distribution, and end-of-life processing of printed advertising materials and their associated editorial content.
The model aligns with GMSF and covers the following categories:
| Lifecycle Category | Emissions Source | Includes |
| ------------------ | ------------------------- | ------------------------------------------------------------------------------------------------------------------------- |
| Creation | Physical print production | Paper production & transport, printing & finishing (ink, consumables), paper production & transport, printing & finishing |
| Distribution | Storage & delivery | Transportation to storage, storage (where material), distribution to points of sale/letterboxes |
| All | Corporate | Corporate emissions |
| Consumption | End-of-life processing | Transportation of unsold materials, recycling, incineration, landfill treatment |
## Emissions Calculation Methodology
### Production Emissions
### Paper Production
We estimate paper-related emissions based on physical dimensions, paper weight (gsm), and production emission factors. When publication-specific data is available, we use those values; otherwise, we apply defaults based on print medium type (newspaper, magazine, leaflet).
Paper emissions include raw material extraction, pulp processing, and paper manufacturing. The calculation accounts for both the ad material and a proportional allocation of editorial content based on the ad-to-content ratio.
### Printing & Finishing
Printing and finishing emissions include prepress, printing processes, consumables (ink, glue), and packaging. Default emission factors vary by print medium, reflecting differences in production intensity between newspapers, magazines, and leaflets.
### Paper Transport
We estimate emissions from transporting paper from mills to printers using distance-based calculations and freight transport emission factors. Default transport distances are country-specific where data is available.
### Distribution Emissions
### Transportation to Storage
Emissions from transporting printed materials from printers to storage facilities are calculated using freight transport emission factors and default transport distances.
### Storage
Storage emissions are considered minimal for print materials stored in ambient conditions. In line with GMSF guidance, we do not currently model storage emissions but may introduce factors for climate-controlled storage in future iterations.
### Downstream Distribution
We model emissions from distributing printed materials from storage to points of sale or direct delivery to letterboxes. This uses van-based transport emission factors and estimated delivery distances.
### End-of-Life Processing
### Unsold Materials
We account for emissions from transporting and processing unsold materials, applying print medium-specific sell-through rates. Unsold materials are allocated across recycling, incineration, and landfill disposal methods using defaults that reflect typical waste management practices.
### Post-Reader Disposal
For materials that reach readers, we apply country-specific recycling, incineration, and landfill rates to reflect regional waste management infrastructure. Each disposal method has distinct emission factors:
* Recycling: lowest emissions
* Incineration: moderate emissions from combustion
* Landfill: highest emissions due to methane generation
### Print Spoilage
We apply a print medium-specific waste rate to account for spoilage during the press run, typically 5% for newspapers and magazines.
### Corporate Emissions
Corporate emissions are allocated on a per-page basis, reflecting the publisher's operational footprint. This follows the same methodology as described in [Corporate Emissions](https://claude.ai/chat/corporate_model).
## Publication Object
To enable granular and accurate measurement, print publications are represented by a publication object that carries attributes relevant for emissions estimation. This is conceptually similar to the "screen" object used for DOOH.
### Publication Attributes
The accuracy of emissions estimates for print depends on the granularity of data provided. The most precise results come from publication-level data shared by publishers.
| Attribute | Description | Example Value |
| ------------------------------ | ---------------------------------------------- | ---------------- |
| Publication Identifier | Unique identifier for the publication | "vogue-us-print" |
| Media Owner | Organization that owns the publication | "Condé Nast" |
| Print Medium | Type of print publication | "magazine" |
| Country | Primary distribution country | "US" |
| Circulation | Average copies distributed per issue | 500,000 |
| Physical Width / Height | Page dimensions in millimeters | 210mm × 297mm |
| Paper GSM | Paper weight in grams per square meter | 90 |
| Total Pages per Issue | Average page count | 100 |
| Ad-to-Content Ratio | Percentage of content that is advertising | 0.50 (50%) |
| Readers per Copy | Average number of readers per copy | 5.0 |
| Sell-through Rate | Percentage of printed copies distributed | 65% |
| Paper Production Emissions | Custom emission factor per page (if available) | 2.5 gCO2e/page |
| Printing & Finishing Emissions | Custom emission factor per page (if available) | 1.5 gCO2e/page |
## Translating Print Metrics to Impressions
Print advertising is often reported in physical copies or circulation figures rather than individual impressions. We convert between these metrics using:
**Print Circulation** is the number of copies distributed (sold or otherwise provided) per issue, verified by audit bureaux.
**Readership** represents the estimated number of people who read or are exposed to an issue. Readership is typically higher than circulation due to pass-along readership (shared copies in waiting rooms, households, etc.).
**Readers per Copy (RPC)** is the multiplier showing how many people on average read one copy.
We estimate total impressions using:
```
impressions = circulation × readers_per_copy × ad_visibility_probability
```
Where ad visibility probability reflects the likelihood that a given ad placement is viewed, which varies by format, section, and position within the publication.
## Potential Improvements
This is the first version of our print emissions model, and we expect it to evolve as better data and industry standards emerge. Key areas of focus for future iterations could include:
* Material-specific emission factors (coated vs. uncoated paper, recycled content)
* Transport mode-specific factors (electric vs. diesel delivery vehicles)
* Refined recycling modeling: incorporating more accurate data on recycling rates and emissions from different end-of-life scenarios
* Regionalized defaults: applying localized emission factors for printing, storage, and disposal processes, reflecting regional infrastructure and grid intensity
* Integration with industry data: leveraging data shared by media owners and print associations to replace assumptions with verified inputs
# Traditional Radio
## Definition and Scope
We classify Traditional Radio as content that is transmitted via traditional broadcast methods and follows a predetermined programming schedule.
## Glossary
| Term | Definition |
| ------------------- | --------------------------------------------------------------------------------------------------------------- |
| Radio Network | The organization or company responsible for distributing radio content (e.g., BBC). |
| Radio Station | A specific frequency within a radio network (e.g., BBC Radio 1). |
| Broadcast Method | The type of infrastructure used to transmit broadcast audio content (e.g., OTA/DAB, FM, Satellite). |
| Co-listening Factor | An average number of listeners per radio device, used to estimate device-level reach from audience impressions. |
## Definition of Broadcast methods
| Broadcast method | Definition |
| ------------------ | ------------------------------------------------------------------------------------------------------------------------ |
| FM | For Frequency Modulation: Radio broadcasting that varies the frequency of the carrier wave. |
| AM | For Amplitude Modulation: Radio broadcasting that varies the amplitude of the carrier wave; enables long-range coverage. |
| Over-the-air (OTA) | Includes terrestrial digital radio broadcasting methods such as DAB(+), DRM, HD Radio, ISDB-Tsb |
| Satellite | Includes large-scale, satellite radio services like SiriusXM |
We assume that, for all audio broadcast methods, the consumer device is the only required equipment.
## Measurement Boundaries & GMSF Alignment
The Scope3 Traditional Radio model focuses on estimating emissions coming from the distribution (broadcasting) and consumer listening to audio content and advertising.
| Lifecycle Category | Emissions Source | Status | Includes |
| -------------------------------- | ----------------------------------------------------- | ------------ | ----------------------------------------------------------------------------- |
| Media Production | Content production | Not Included | |
| Creative Production | Ad production | Not included | |
| Tech Manipulation | Post-production storage & Others technical operations | Not included | |
| Media Distribution | Corporate emissions from radio network | Included | |
| Media & Creative Distribution | Broadcast Signal preparation & transmission | Included | Encoding, multiplexing and transmission infrastructure (use phase & embodied) |
| Media & Creative Consumer Device | Reception & Audio listening | Included | Radio device used for reception (use phase & embodied) |
## Emissions Calculation Methodology
### Corporate Emissions
Similarly to Linear TV, we estimate corporate emissions per radio spot rather than per audience or household impression. We do this to avoid having differing numbers depending on fluctuating Radio ratings. All other aspects of our calculations for corporate emissions remain as described in [Corporate Emissions](./corporate_model).
### Broadcast Signal Emissions
In [*The energy footprint of BBC radio services: now and in the future*](https://downloads.bbc.co.uk/rd/pubs/whp/whp-pdf-files/WHP393.pdf) (2020) the BBC provides estimated energy use for each broadcasting method for BBC radio in 2018, broken down by process:
* Signal Preparation,
* Signal Distribution, referred to as Signal Transmission below,
* and Consumption, covering the energy use of consumer radio receiver devices.
#### Signal Preparation
The BBC estimates that signal preparation energy is marginal for all audio broadcasting methods. We derive average defaults from our Linear TV methodology. For networks and/or channels where actual power usage data is available, we use those values instead of the average.
#### Signal Transmission
**Energy Use & Embodied Emissions**
For each audio broadcast method, we assume a fixed energy consumption required to transmit the signal from the [BBC](https://downloads.bbc.co.uk/rd/pubs/whp/whp-pdf-files/WHP393.pdf) study, regardless of the number of radio devices receiving it.
We use the total annual signal transmission energy, divided by the number of supported radio stations, to estimate the average power per radio channel for each broadcast method. The resulting figures are consistent with other studies from [Bayerischer Rundfunk](https://www.worlddab.org/public_document/file/1460/Report_Green-Radio_BLM_BR_E_Web.pdf?1636114991), [MDR](https://www.worlddab.org/system/news/documents/000/011/985/original/Digitalradio_Vortrag_Daemmerschoppen_final_%28002%29.pdf?1619108841), [GatesAir](https://www.gatesair.com/media-center/news/gatesair-amplifies-efficiency-savings-for-dab-radio-networks).
From BBC, for FM the total reported annual energy consumption for signal transmission is `26 GWh`, covering eight national stations and 41 local stations. We assume that the coverage of ten local stations is equivalent to that of one national station.
The calculation for FM is:
```
26 (GWh) / 12.1 (national equivalent stations) / 365 (days) / 24 (hours) * 1,000,000 (GWh to kWh) = ~245 kWh / hour / station
```
In the absence of embodied emissions data specific to each audio broadcast method, we adapted the formula and assumptions used for linear TV.
**Limitation:** The signal transmission energy per station should be linked to geographic coverage. The current values are of the right order of magnitude for the UK’s coverage but will overestimate emissions for smaller coverage areas (e.g., regional stations or smaller countries) and underestimate them for larger ones.
The resulting power draws & embodied emissions of each audio broadcast method for the signal transmission of one radio channel are:
| Audio Broadcast Method | Energy consuming sources | Signal Transmission Power per Radio Channel | Embodied emissions gCO2e/s | Source(s) | Assumptions |
| ---------------------- | --------------------------------------------------------- | ------------------------------------------- | -------------------------- | -------------------------------------------------------------------------------------------------------------------------------------------------------------------------------------------------------------------------------------------------------------------------------------------------------------------------------------------------------------------------------------------------------------------------------------------------------------------------------------------------------------------------------------------------------------------------------------------------------------------------------- | -------------------- |
| FM | FM transmission infrastructure | 245 kW | 7g | [ADEME ARCEP](https://www.editionmultimedia.fr/wp-content/uploads/2024/10/Rapport-Arcom-Arcep-Ademe-Impact-environnemental-2022-2030-de-laudiovisuel-07-10-24.pdf), [BBC](https://downloads.bbc.co.uk/rd/pubs/whp/whp-pdf-files/WHP393.pdf) | |
| AM | AM transmission infrastructure | 273 kW | 10g | [ADEME ARCEP](https://www.editionmultimedia.fr/wp-content/uploads/2024/10/Rapport-Arcom-Arcep-Ademe-Impact-environnemental-2022-2030-de-laudiovisuel-07-10-24.pdf), [BBC](https://downloads.bbc.co.uk/rd/pubs/whp/whp-pdf-files/WHP393.pdf) | |
| OTA/DAB | Over the air transmission network | 106 kW | 5g | [ADEME ARCEP](https://www.editionmultimedia.fr/wp-content/uploads/2024/10/Rapport-Arcom-Arcep-Ademe-Impact-environnemental-2022-2030-de-laudiovisuel-07-10-24.pdf), [BBC](https://downloads.bbc.co.uk/rd/pubs/whp/whp-pdf-files/WHP393.pdf), [Bayerischer Rundfunk](https://www.worlddab.org/public_document/file/1460/Report_Green-Radio_BLM_BR_E_Web.pdf), [MDR](https://www.worlddab.org/system/news/documents/000/011/985/original/Digitalradio_Vortrag_Daemmerschoppen_final_%28002%29.pdf?1619108841), [GatesAir](https://www.gatesair.com/media-center/news/gatesair-amplifies-efficiency-savings-for-dab-radio-networks) | |
| Satellite | Uplink transmission from Radio station tower to satellite | 3.15 kW | 6g | [BBC](https://downloads.bbc.co.uk/rd/pubs/whp/whp-pdf-files/WHP189.pdf) | Similar to Linear TV |
For radio networks and/or channels where actual data are available, we use the contributed values instead of the above defaults.
### Broadcast Method Usage
The prevalence of each audio broadcast method varies geographically. For example, in France FM is the most widely used broadcast methods in terms of consumption, whereas in the UK OTA/DAB+ is the most prevalent method ([Ofcom](https://www.ofcom.org.uk/siteassets/resources/documents/research-and-data/multi-sector/media-nations/2025/media-nations-2025-uk-report.pdf)).
We apply a country-specific ratio of broadcast methods for major markets, and use a global average for other countries.
| Country | % of total radio listening FM | % of total radio listening AM | % of total radio listening OTA/DAB | % of total radio listening Satellite | Source |
| --------------- | ----------------------------- | ----------------------------- | ---------------------------------- | ------------------------------------ | ---------------------------------------------------------------------------------------------------------------------------------------------------------------------------------------------------------------------------------------- |
| Global Defaults | 60% | 15% | 20% | 5% | |
| FR | 95% | insignificant | 5% | 0% | [ADEME ARCEP](https://www.editionmultimedia.fr/wp-content/uploads/2024/10/Rapport-Arcom-Arcep-Ademe-Impact-environnemental-2022-2030-de-laudiovisuel-07-10-24.pdf) |
| UK | 39% | grouped with FM | 61% | 0% | [Ofcom](https://www.ofcom.org.uk/siteassets/resources/documents/research-and-data/multi-sector/media-nations/2025/media-nations-2025-uk-report.pdf) / [RAJAR](https://www.rajar.co.uk/docs/news/RAJAR_DataRelease_InfographicQ22025.pdf) |
| AU | 75% | grouped with FM | 25% | 0% | [GFK Radio Ratings](https://james.cridland.net/blog/2025/how-australians-listen/) |
This distribution is only for audio broadcasting methods, digital audio consumption over the internet is modelled in the dedicated **`digital-audio`** channel. We will continue to add country-specific distributions as we obtain additional data.
## Radio Device Emissions
We follow the same methodology as described [Consumer Devices](./consumer_devices), accounting for both use phase (energy consumption) and embodied emission (production & disposal). Since we do not have deterministic data on the devices used to listen to a given radio spot, we define a “synthetic Radio system” representative of the average listener.
See [Consumer Devices - Radio](./consumer_devices#radio) for more details.
## Estimating the number of Radio Spot impressions
We consider an impression to be one person listening to a radio spot. Similarly to the Linear TV methodology, we estimate the number of radio devices reached using a co-listening factor of 1.5, in line with published audience measurement benchmarks across major markets. This means that for every 1.5 audience impressions, we assume one radio receiving device was used to listen to the content.
# Consumer devices
Source: https://methodology.scope3.com/consumer_devices
# Measuring Emissions for Consumer Devices
## Overview of Emissions by Device
This graphic, from [Malmodin and Lundén](#malmodin-and-lundén-2018), is a useful overview of emissions from production vs use phase. Note that the numbers here are slightly different than the aggregated conclusions we draw below.
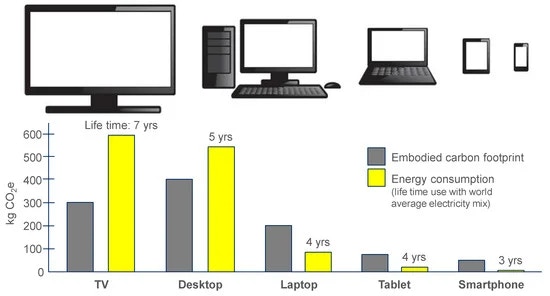 ## Calculating Lifecycle Emissions Per Second of Use
The *Lifecycle Annual Footprint* (LAF) of a particular device, per [Belkhir and Elmeligi](#belkhir-and-elmeligi-2018), is the Use Phase Energy (UPE) plus the Production Energy (PE) divided by the Useful Life (UL). In other words, "the Lifecycle Annual Footprint accounts for the annual footprint of both the use phase as well as the production energy, depreciating the production energy over the useful lifetime of the device.
`LAF = (UPE + PE) / UL`
Production is done around the world, not where consumer use occurs, whereas we need to calculate the UPE based on the consumer's grid mix. We calculate *Production Energy per Use Second* (PEPS) using the daily usage in hours (DU):
`PEPS = PE / (365 • UL • DU • 3600)`
To calculate the *Lifecycle Emissions Per Second of Use* (LEPS), we multiply the grid intensity of the consumer's location (GI) and the usage energy of the consumer device (UEPS) and add this to the production energy per second (PEPS).
`LEPS = PEPS + GI • UEPS`
The following sections outline the sources and assumptions used to calculate these metrics for various device types. Note that, after the release of the [October 2025 Emission Model](https://docs.scope3.com/changelog/october-2025-emissions-model#/), we use the default emission factors from version 1.2 of the Global Media Sustainability Framework (GMSF) for these consumer devices: TV, Phone, Tablet and Personal Computer.
## Personal Computer
From [Negaoctet](#Negaoctet):
| Device | Lifetime impact excluding use (kgCO2e) | Description |
| ------- | -------------------------------------- | ----------------------------------------------------------------------------------------------------------------------------------------------------------- |
| Desktop | 277 | Desktop; personal use; average configuration: 1 CPU, 10 GB RAM, 1173 GB HDD, 442 GB SSD, mix of integrated or separated graphic card, 6 years lifespan; RAS |
| Laptop | 175 | Laptop; use mix, personal use; average configuration: 14,6 inches screen, 1 CPU, 11 GB RAM, 497 GB SSD, 5 years lifespan; RAS |
| Monitor | 69 | Computer monitors; use mix, personal and professional use; average dimension (24 inches) and technology (98.6% LCD, 1.4% OLED), 6,6 years lifespan; RAS |
From [Urban et al](#urban-et-al-2019):
| Device | Installed base (M) | Power Draw (w) | Usage (h/day) |
| ------- | ------------------ | ---------------------- | ------------------------ |
| Desktop | 72 | 59 (idle), 85 (active) | 4.6 (idle), 4.8 (active) |
| Laptop | 122 | 11 (idle), 22 (active) | 3.0 (idle), 3.7 (active) |
| Monitor | 101 | 30 | 5.5 |
Since we do not know the exact device a consumer is using (most reporting is aggregated to device type), we used to use the install base to create a synthetic "personal computer". See [PC emissions model](supporting/pc_emissions_model.xlsx). Based on this analysis, a personal computer uses an average of 53.2 W of energy while in use, and has Production Energy of 0.005 gCO2e per second of use.
 We use the following defaults from [GMSF 1.2](https://adnetzero.com/wp-content/uploads/2025/06/GlobalMediaSustainabilityFrameworkV1.2.pdf): a use-phase energy intensity of 0.0000154 kWh per second (55.44 W power draw) and embodied emissions of 0.00000545 kgCO2e per second. The listed data sources are ADEME ([Base Empreinte, "Numérique 2.0" dataset, 2025](https://base-empreinte.ademe.fr/)) and Scope3.
## Tablet
From [Negaoctet](#Negaoctet), a "Tablet; use mix, personal or professional use; average configuration: 10.44 inches screen mix of LCD screen, 4 GB RAM, 121 GB memory, 3 years lifespan; RAS" has 25.3 kgCO2e per year of embodied emissions.
We don't have a stat on daily usage of tablets. Assuming that people use them in lieu of a laptop, taking the laptop number of 6.7 hours a day. This yields a PEPS of 0.00287 gCO2e/s.
For energy use, [iBatteryLife](https://ibatterylife.com/ipad-battery-life-test/) compares multiple iPad models and battery life is around 10 hours for each. The average iPad, per [Sir Apfelot](https://sir-apfelot.de/en/battery-capacity-ipad-mah-19060/), has around 30 Wh of battery capacity. Thus, a tablet has an average power draw of 3W.
We use the following defaults from [GMSF 1.2](https://adnetzero.com/wp-content/uploads/2025/06/GlobalMediaSustainabilityFrameworkV1.2.pdf): a use-phase energy intensity of 0.0000014 kWh per second (5.04 W power draw) and embodied emissions of 0.0000257 kgCO2e per second. The embodied emission factor is much higher than for the other devices due to considering low daily usage. The listed data source is ADEME ([Base Empreinte, "Numérique 2.0" dataset, 2025](https://base-empreinte.ademe.fr/)).
## Smartphone
From [Negaoctet](#Negaoctet), a "smartphone; use mix, personal use; average configuration: 6,61 inches screen mix of LCD and OLED technologies, 7,3 GB RAM, 180 GB memory, 2,5 years lifespan; RAS" has 33.6 kgCO2e per year of embodied emissions.
The typical person uses her phone for 4 hours and 23 minutes a day per [Statista](https://www.statista.com/statistics/1045353/mobile-device-daily-usage-time-in-the-us/). This yields a PEPS of 0.0058 gCO2e/s. (Note: SRI uses a 3 hrs/day number)
As an example, per [GSM Arena](#gsmarena), the Apple iPhone 13 takes 16 hours and 8 minutes to run out of battery when browsing the internet (similar to video playback). In idle mode, it takes 174 hours to discharge. It has 12.41Wh of battery capacity per [Macworld](#macworld). Thus, the iphone consumes 0.77W when active, and 0.071W when idle.
We use the following defaults from [GMSF 1.2](https://adnetzero.com/wp-content/uploads/2025/06/GlobalMediaSustainabilityFrameworkV1.2.pdf): a use-phase energy intensity of 0.0000013 kWh per second (4.68 W power draw) and embodied emissions of 0.00000655 kgCO2e per second. The use-phase value is considered conservative and based on video playback. The listed data source is ADEME ([Base Empreinte, "Numérique 2.0" dataset, 2025](https://base-empreinte.ademe.fr/)).
## Television
From [Urban et al](#NRDC-2019):
| Device | Installed base (M) | Power Draw (w) | Usage (h/day) |
| ---------------- | ------------------ | -------------------- | ----------------------- |
| Television | 284 | 74 | 3.9 |
| STB: Non-DVR | 113 | 22 | 11.7 |
| STB: DVR | 54 | 13 | 11.7 |
| STB: Thin Client | 33 | 7 | 11.7 |
| STB: DTA Adapter | 31 | 5 | 24 |
| Sound Bar | 20 | 14 (active) 9 (idle) | 4.4 (active) 5.7 (idle) |
We combine these using install base to create a synthetic "TV System" that represents the full power draw of the consumer setup. The weighted power draw of a typical setup is 87.4 watts.
From the [Negaoctet database](#Negaoctet), the production emissions from a 45" television (98.6% LCD, 1.4% OLED) are 45 kgCO2e per year over an 8 year useful life.
Based on the above Urban data, 58.8% of TVs have set top boxes. From the Negaoctet data, the production emissions from a set top box are 7.22 kgCO2e per year for a "Modem; use mix, personal and professional use; xDSL, FTTx, 5 years lifespan; RAS"
Based on 3.9 hours/day of usage, the embodied emissions from a TV and set top box are 0.0096 gCO2e/s.
A detailed study of many TV models can be found at [ecocostsavings.com](https://ecocostsavings.com/tv-wattage/), indicating that the average power draw of a TV in the US is 59W active, 0.5W standby. This data is not tied to a scientific study but does indicate that overall power usage may have declined since the Urban study above.
We use the following defaults from [GMSF 1.2](https://adnetzero.com/wp-content/uploads/2025/06/GlobalMediaSustainabilityFrameworkV1.2.pdf): a use-phase energy intensity of 0.000038 kWh per second (136.8 W power draw) and embodied emissions of 0.00000865 kgCO2e per second. The listed data source is ADEME ([Base Empreinte, "Numérique 2.0" dataset, 2025](https://base-empreinte.ademe.fr/)).
## Smart Speaker
From a [NRDC report by Horowitz, Hardy, and Tian](#nrdc-2019):
| Device | Installed base (M) | Power draw (W) | Usage (h/day) |
| --------------------- | ------------------ | -------------- | ------------- |
| Google Home Mini | 4 | 1.7 | 3.5 |
| Amazon Echo (2nd gen) | 35 | 2.4 | 3.5 |
| Google Home | 8 | 2.2 | 3.5 |
| Apple HomePod | 3 | 5.9 | 3.5 |
The weighted power draw of a typical smart speaker is 2.5 watts.
Assuming a use life of 3 years for a smart speaker (similar to a tablet) and 84 kgCO2e of impact from ([Amazon Echo Dot LCA](#amazon-2023)) and 3.5 hours/day of usage, the embodied emissions from a smart speaker are 0.0061 gCO2e/s.
## Radio
Since we do not have deterministic data on the devices used to listen to a given radio spot, we define a “synthetic Radio system” representative of the average listener. Similar to the [Television](#television) device, we calculate the average use and embodied impacts for each type of receiver and combine this with a usage distribution to get a representative number.
Below, we detail our assumptions and sources for each component of the calculation.
### Device lifespan
| Studies / Source | Car Audio (years) | Portable Receiver (years) | Hi-Fi (years) | Alarm Clock Radio & Docking Station (years) |
| ---------------------------------------------------------------------------------------------------------------------------------------------------------------------------------- | ----------------- | ------------------------- | ------------- | ------------------------------------------- |
| [ADEME ARCEP](https://www.editionmultimedia.fr/wp-content/uploads/2024/10/Rapport-Arcom-Arcep-Ademe-Impact-environnemental-2022-2030-de-laudiovisuel-07-10-24.pdf) - France (2024) | 10 | 5 | 5 | 5 |
| [ACEA](https://www.acea.auto/figure/average-age-of-eu-vehicle-fleet-by-country/) - Europe (2022) | 12.3 | | | |
| [Bureau of Transportation Statistics](https://www.bts.gov/content/average-age-automobiles-and-trucks-operation-united-states) - USA (2024) | 14 | | | |
| [Department for Transport & Ricardo](https://assets.publishing.service.gov.uk/media/623b0fb28fa8f540f3202c12/lifecycle-analysis-of-UK-road-vehicles.pdf) - UK (2024) | 14 | | | |
| [FordAV](https://www.fordav.com/solutions/lifecycle-of-av-systems/) - Global (N/A) | | | 10+ | |
| WW Assumption | 10 | 5 | 10 | 5 |
### Daily Usage
| Studies / Source | Car Audio (hours per day) | Portable Receiver (hours per day) | Hi-Fi (hours per day) | Alarm Clock Radio & Docking Station (hours per day) |
| ------------------------------------------------------------------------------------------------------------------------------------------------------------------------------------------ | ----------------------------------------------------------------- | --------------------------------- | --------------------- | --------------------------------------------------- |
| [ADEME ARCEP](https://www.editionmultimedia.fr/wp-content/uploads/2024/10/Rapport-Arcom-Arcep-Ademe-Impact-environnemental-2022-2030-de-laudiovisuel-07-10-24.pdf) - France (2024) | 0.75 | 2 | 2 | 2 |
| [ICT Impact](https://susproc.jrc.ec.europa.eu/product-bureau/sites/default/files/2020-11/IA_report-ICT_study_final_2020_\(CIRCABC\).pdf) - Europe (2020) | | 2 | 2 | 2 |
| [EBU Audio in Cars](https://www.worlddab.org/files/document/file/4868/2.2_2023-06-21_150623_Automotive_WorldDAB_Matthieu_Rawolle_updated_v_for_WDAB_upload.pdf?1687340460) - Europe (2022) | 0.5 | | | |
| [Rajar All Radio Listening](https://www.rajar.co.uk/docs/news/RAJAR_DataRelease_InfographicQ12024.pdf) - UK (2024) | 0.73 (20.5 hours per week, 25% in car) | | | |
| [Edison Research Share of Ear](https://www.edisonresearch.com/wp-content/uploads/2023/04/Gen-Z-In-Car-Audio-NAB-2023-1.pdf) - USA (2022) | 0.6 (1 hour and 3 min daily audio in car from which 59% is AM/FM) | | | |
| WW Assumption | 0.75 | 2 | 2 | 2 |
### Embodied Emissions
| Studies / Source | Car Audio (kgCO2e) | Portable Receiver (kgCO2e) | Hi-Fi (kgCO2e) | Alarm Clock Radio & Docking Station (kgCO2e) |
| ------------------------------------------------------------------------------------------------------------------------------------------------------------------------------------ | ------------------ | -------------------------- | -------------- | -------------------------------------------- |
| Derived from [ADEME ARCEP](https://www.editionmultimedia.fr/wp-content/uploads/2024/10/Rapport-Arcom-Arcep-Ademe-Impact-environnemental-2022-2030-de-laudiovisuel-07-10-24.pdf) LCAs | 3.62E+01 | 1.66E+01 | 3.62E+01 | 1.66E+01 |
| WW Assumption | 3.62E+01 | 1.66E+01 | 3.62E+01 | 1.66E+01 |
### Use Emissions
| Energy Consumption and Electricity Source | Car Audio (W) | Portable Receiver (W) | Hi-Fi (W) | Alarm Clock Radio & Docking Station (W) |
| ---------------------------------------------------------------------------------------------------------------------------------------------------------------------------------- | -------------------------- | --------------------- | --------- | --------------------------------------- |
| [ADEME ARCEP](https://www.editionmultimedia.fr/wp-content/uploads/2024/10/Rapport-Arcom-Arcep-Ademe-Impact-environnemental-2022-2030-de-laudiovisuel-07-10-24.pdf) - France (2024) | 38 (diesel) | 4.8 (grid) | 38 (grid) | 4.8 (grid) |
| [Intertek](https://assets.publishing.service.gov.uk/media/5a7c7d0940f0b62aff6c2062/DRAP_Future_Energy_Report.pdf) - UK (2013) | | 4.69 (grid) | | |
| WW Assumption | 38 (diesel) - conservative | 4.8 (grid) | 38 (grid) | 4.8 (grid) |
For the usage phase of Car Audio, we use the [ADEME ARCEP](https://www.editionmultimedia.fr/wp-content/uploads/2024/10/Rapport-Arcom-Arcep-Ademe-Impact-environnemental-2022-2030-de-laudiovisuel-07-10-24.pdf) approach considering the power consumption of a car radio to be equal to that of Hi-Fi systems, at 38 Wh/h. Using a thermal engine efficiency of 40%, an alternator efficiency of 80%, and an energy content of 8.9 kWh per liter of fuel, the volume of fuel required for the operation of the car radio over a given period of time is calculated.
We use an average Diesel oil combustion emission factors (2.7 kgCO2e/l) based on several sources:
* [Road diesel](https://www.climatiq.io/data/emission-factor/a7d2d6c2-8d54-418e-8c18-427296c90e50) (ADEME - France): 2.41 kgCO2e/l
* [Diesel - 100% mineral diesel](https://www.climatiq.io/data/emission-factor/3009b630-e04b-4251-a6d3-52480f3a7fd4) (BEIS/Defra - UK): 2.662 kgCO2e/l
* [Diesel oil - Euro iii - heavy duty vehicles](https://www.climatiq.io/data/emission-factor/3b1bc1de-a726-4574-bba0-4524ee854b9d) - transport (NGER - AU): 2.717 kgCO2e/l
We calculate that supplying 38W of electricity requires `118.75W` from a diesel car engine: (`38(W) / 0.8 (alternator) / 0.4 (thermal engine)`).
* Converted in liters of diesel: `118.75 / 8900 = 0.0133 liter`.
* Converted in GHG emissions: `0.0133 * 2.7 = 0.036 kgCO2e` per hour.
### Linear Radio Consumption Distribution by Device
| Market | Car Audio | Portable Receiver | Hi-Fi | Alarm Clock Radio & Docking Station | Source |
| ------------- | ----------------- | ----------------- | ----- | ----------------------------------- | ------------------------------------------------------------------------------------------------------------------------------------------------------------------------------------------------------------------------ |
| FR | 43% | 22% | 17.5% | 17.5% | [ADEME ARCEP](https://www.editionmultimedia.fr/wp-content/uploads/2024/10/Rapport-Arcom-Arcep-Ademe-Impact-environnemental-2022-2030-de-laudiovisuel-07-10-24.pdf) p.111 Sankey Diagram |
| US | dominant (50-60%) | | | | [Edison Research - Share of Ear](https://www.mediajobsreport.com/articles/am-fm-radio-dominates-in-car-listening-new-edison-%E2%80%98share-of-ear%E2%80%99-analysis-finds) |
| UK | 62% | | | | [Ofcom Audio Survey 2025](https://www.ofcom.org.uk/siteassets/resources/documents/research-and-data/multi-sector/media-nations/2025/media-nations-2025-uk-report.pdf?v=401287) (p93) indicates share of ears by location |
| AU | \~40+% | | | | [GfK Australian Share of Audio 2022](https://47012339.fs1.hubspotusercontent-ap1.net/hubfs/47012339/Insights/GfK_SOA_COMMERCIAL_External_VER02_300123-Final.pdf) p.20 |
| WW Suggestion | 50% | 25% | 12.5% | 12.5% | |
### Synthetic Radio Device Profile
| Device | Lifespan (years) | Daily Usage (hours) | Total Hours | Total Embodied Emissions (kgCO2e) | Embodied Emissions per s (gCO2e) | Energy consumption per s (W) | Use Emissions per s (gCO2e) | Distribution |
| ----------------------------------- | ---------------- | ------------------- | ------------------ | --------------------------------- | ------------------------------------------ | ---------------------------- | ---------------------------- | ------------ |
| Car Audio. | 10 | 0.75 | 2700 (10*360*0.75) | 3,62E+01 | 3,72E-03 (3,62E+01 / (2700 \* 3600)\*1000) | 38 | 0.01 (0.036 kgCO2e per hour) | 50% |
| Portable Receiver | 5 | 2 | 3600 | 1,66E+01 | 1,28E-03 | 4.8 | electricity grid EF | 25% |
| Hi-Fi | 10 | 2 | 7200 | 3,62E+01 | 1,40E-03 | 38 | electricity grid EF | 12.5% |
| Alarm Clock Radio & Docking Station | 5 | 2 | 3600 | 1,66E+01 | 1,28E-03 | 4.8 | electricity grid EF | 12.5% |
| **Synthetic Radio Device** | 8.125 | 1.375 | 3600 | 2.88E+01 | 0.002514375 | 6.55 (excl. car audio) | | |
## Summary
| Device | Power Draw (W) | PEPS (gCO2e/s) |
| ----------------- | ------------------- | -------------- |
| Personal computer | 53.2 | 0.007 |
| Tablet | 3 | 0.0029 |
| Smartphone | 0.77 | 0.0058 |
| TV System | 87.4 | 0.0096 |
| Smart Speaker | 2.5 | 0.0061 |
| Radio | 6.55 (excl. in-car) | 0.0025 |
## Notes and Caveats
* All of our data is US-centric and probably does not represent typical devices or configurations in less-wealthy countries.
## References
### Belkhir and Elmeligi, 2018
Lotfi Belkhir, Ahmed Elmeligi,
[Assessing ICT global emissions footprint: Trends to 2040 & recommendations](https://doi.org/10.1016/j.jclepro.2017.12.239),
Journal of Cleaner Production, Volume 177, 2018, Pages 448-463, ISSN 0959-6526.
### Macworld
[iPhone Battery Capacities Compared](https://www.macworld.com/article/678413/iphone-battery-capacities-compared-all-iphones-battery-life-in-mah-and-wh.html)
### GSM Arena
[GSM Arena battery calculator](https://www.gsmarena.com/battery-test.php3)
### Urban et al, 2019
Urban, Bryan & Roth, Kurt & Singh, Mahendra & Howes, Duncan. (2019). [Residential Consumer Electronics Energy Consumption in the United States in 2017](https://www.researchgate.net/publication/335911295_Residential_Consumer_Electronics_Energy_Consumption_in_the_United_States_in_2017). 10.2760/667696.
### Hischier and Baudin, 2010
Hischier, Roland & Baudin, Isabelle. (2010). [LCA study of a plasma television device](https://www.researchgate.net/publication/226516835_LCA_study_of_a_plasma_television_device). The International Journal of Life Cycle Assessment. 15. 428-438. 10.1007/s11367-010-0169-2.
### Kwiecień et al, 2019
Kwiecień, Klaudia & Kania, Gabriela & Malinowski, Mateusz. (2019). [The life cycle assessment (LCA) of selected TV models](https://www.researchgate.net/publication/341785058_The_life_cycle_assessment_LCA_of_selected_TV_models).
### Malmodin and Lundén, 2018
Malmodin J, Lundén D. [The Energy and Carbon Footprint of the Global ICT and E\&M Sectors 2010–2015](https://doi.org/10.3390/su10093027). Sustainability. 2018; 10(9):3027.
### Negaoctet
[Description of Negaoctet](https://codde.fr/en/our-software/negaoctet/database)
[Negaoctet ADEME database 1.4](https://base-impacts.ademe.fr/documents/Negaoctet1.4.zip)
### NRDC, 2019
Horowitz, Hardy, and Tien. [The Energy Impacts of Smart Speakers and Video Streaming Devices](https://www.nrdc.org/sites/default/files/gadget_report_r_19-07-b_13_locked.pdf), August 2019
### Amazon, 2023
[Amazon Echo Show 5 3rd Gen Product Sustainability Fact Sheet](https://sustainability.aboutamazon.com/devices_fact_sheet_echo_show_5.pdf)
### ADEME ARCEP, 2024
[Study of the Environmental Impact of Audiovisual Usage in France - ADEME ARCEP](https://www.editionmultimedia.fr/wp-content/uploads/2024/10/Rapport-Arcom-Arcep-Ademe-Impact-environnemental-2022-2030-de-laudiovisuel-07-10-24.pdf), (FR)
# Corporate model
Source: https://methodology.scope3.com/corporate_model
# Estimating corporate emissions
Imagine a company that has done a perfect job of measuring its carbon emissions. This company would have analyzed every expense in its financials, gone a level deeper to get activity data, performed lifecycle analysis on each of its products, and then asked each company in its supply chain to do the same.
This idealized company does not exist, though Google, Microsoft, Axel Springer, and Salesforce - among others - are making substantive efforts to get there. We can think of this as a spectrum where on the far left is a company that has done nothing to measure its emissions, on the middle-right are these best-of-breed companies, at at the far right is this idealized company who has measured everything.
We need a way to estimate corporate emissions based on the information we have available. We can translate the spectrum above into a table that translates what we know into a methodology to fill in the gaps of what we don't know:
| What we know | Estimation methodology |
| ----------------------------------------------------------------------------------------------------------------------------------------- | ------------------------------------------------------------------ |
| Nothing | Use industry-average emissions per impression |
| Number of employees | Use industry-average emissions per employee |
| Sustainability report with missing or aggregated scope 3 categories | Use industry-average emissions per employee for missing categories |
| Complete sustainability report with suboptimal methodology (market-based vs location-based, or omitting embodied emissions, for instance) | Use industry average correction factors |
## Mapping emissions into business units
For a company like Google, the corporate sustainability report will be produced for the entire company. Some business units, like YouTube, will be broken out with specific emissions data; other business units will not be.
For a business unit like ad tech inside Google, we need to allocate a percentage of the overall corporate emissions based on percentage of revenue or another method.
## Calculating industry-average emissions factors
In this repository we aggregate public data from companies who produce sustainability reports - for instance, Axel Springer. We pull facts from these reports and use them to produce industry average values including:
* Office Emissions Per Employee Per Month
* Commuting Emissions Per Employee Per Month
* Travel Emissions Per Employee Per Month
* Datacenter Emissions Per Employee Per Month (may include cloud)
* Overhead Emissions Per Employee Per Month (this bucket includes third party software and marketing expenses; we need to get it broken out in a consistent way)
We only include data that includes all scope 3 categories and uses location-based emissions for electricity use. Unfortunately, this means that very few sustainability reports are usable for us, though we expect this to change quickly.
## How we parse and understand corporate sustainability reports
### Scope 3 Aggregation
One of the issues with combining sustainability reports across a supply chain is that, at least in theory, the upstream supply partner should already be accounted for by the downstream partner and vice versa.
In other words, a publisher should be including programmatic supply chain emissions already, as should a DSP, SSP, all the way through to the agency and advertiser. When we parse these reports, we should be excluding these in order to get a non-overlapping boundary.
In practice, at least in 2022, when we have asked companies - both publishers and ad tech companies - they have told us that these emissions are not included in their reporting boundaries today. Therefore we are not making any additional exclusions. In the future, we suggest that companies be explicit about what parts of their value chain are included recursively so that a de-duplication is possible (h/t Benjamin Davy for pointing this out!)
For the purposes of the current project, we are assuming the following categories of scope 3 emissions are fairly comprehensive for companies in the media and advertising space:
### offsets, RECs, and PPAs
to discuss
## Usage
Note: this will change soon to support hierarchical organizations
Create a YAML file that describes the company you would like to model. The YAML file should look like this:
```yaml theme={null}
---
type: corporate
name: Criteo
facts:
- travel_emissions_mt_co2e_per_employee_per_month: 0.011
reference: page 7
source_id: 1
- office_emissions_mt_co2e_per_employee_per_month: 0.0176
- number_of_employees: 2810
raw_facts:
- office_electricity_kwh: 2262000
reference: page 91
source_id: 1
- office_electricity_kwh_per_employee: 860
reference: page 91
source_id: 1
sources:
- id: 1
year: 2021
url: >-
https://filecache.investorroom.com/mr5ir_criteo/1674/Criteo_CSR_Report_2021.pdf
file: Criteo_CSR_Report_2021.pdf
```
The file must have:
* Some number of facts, with `number_of_employees` required at a minimum unless you provide full corporate emissions data.
To model emissions, make sure defaults have been computed. Then run:
```sh theme={null}
./scope3_methodology/cli/model_corporate_emissions.py --verbose {generic,atp,publisher} [company_file.yaml]
```
# Creative
Source: https://methodology.scope3.com/creative
# Measuring the carbon footprint of creatives and ad formats
## Terminology: Placements, Ad Formats, Creatives, and Assets
A *placement* is an empty spot on a particular media property where an ad could be inserted. An "ad hole" if you will! Examples - a rectangle on a web page; the interstitial between levels of a game, the airtime before a podcast starts, a wall at an airport. In an *embedded* placement (web page, social news feed) the ad sits inside content that the user controls. In an *ad-primary* placement the creative IS the content and controls duration.
A *media asset* is an image, video, audio, or text that the advertiser wants to deliver to the consumer. An *ad format* is code, metadata, or other *non-media assets* that, in combination with one or more media assets, facilitate the delivery of the advertisement to the consumer.
A *creative* is one or more media assets combined with an ad format. For instance, a CTV creative would typically be a 15-second or 30-second video (the media asset) wrapped in VAST/VPAID (the ad format) and deployed in a commercial break (the placement).
## Methodology
The lifecycle of a creative starts with its production. Depending on the channel and format, creative production can be very lightweight (typing a couple of lines of text into a search tool) or have a significant carbon footprint (an on-location shoot with a full crew). Currently, this project does not include modeling creative production or transcoding of creative assets, but we are considering these for future development.
The use phase of a creative has three areas of impact:
* The [consumer device](./consumer_devices) uses energy to deliver/render the creative
* Energy is used to [transfer](./data_transfer) the creative from a server to the device
* Various [vendors](./ad_tech_model) participate in the delivery and reporting of the creative.
### Consumer Device Emissions
To determine consumer device emissions we need to know whether the ad controls the user experience or is embedded into the user experience.
* For a full screen or primary placement ad(standard TV/radio commercial, etc) the energy used by the consumer device during the display of the creative is determined by multiplying the duration of the creative by the energy use of the consumer device.
* For an ad that is not full screen that is embedded in content- for instance, a banner ad on a web site, an autoplaying out-stream video, or a sponsored post in a social news feed - the energy use should be proportionate to the percentage of the consumer device used by the creative and the average time that the placement is in view. We align with GMSF 1.2 and assume a default of 3 seconds as the average time an embedded ad is in view.
The time the ad is on the device multiplied by the percentage of the screen/device used by the creative is `device coverage-seconds`. The embodied emissions for the delivery of the creative are `(device coverage-seconds) x (embodied emissions per second)` and the usage emissions are `(device coverage-seconds) x (energy per second)`. See [consumer device methodology](./consumer_devices) for details on the per-device calculations.
For instance, a 30 second video ad played on a television will use 1.14 Wh of energy and an allocation of 0.26 gCO2e from the production of the television. A split-screen ad using half the screen would use half the energy and production emissions.
Format notes:
* We consider out-of-home media to have no consumer device emissions because a consumer device is not required to view the creative
* For dynamic display environments like a website where a banner may use only a fraction of the screen and be viewable for a variable duration, the ideal measurement would use `placement size / screen size x time in view`.
### Tech Manipulation / Physical Production Emissions
For digital channels we model the emissions related to the storage of creative materials (also called the master bundle). We use emission factors per type of storage from [GMSF 1.2](https://adnetzero.com/wp-content/uploads/2025/06/GlobalMediaSustainabilityFrameworkV1.2.pdf), along with assumptions to allocate these emissions per impression:
* the average distribution per storage type,
* the default impressions per creative,
* a default multiplier to estimate the required storage space based on the delivered creative size.
See the [Creative Storage Defaults](./calculations#creative-storage-defaults) for more details and the associated [calculations](./calculations#tech-manipulation-creative-storage).
For OOH and Print channels we model the emissions from the physical production of the ad material.
### Data Transfer Emissions
For all channels, we use the conventional model based on the payload of a creative (the number of bytes transferred to display the ad). We calculate the energy used per GB from the [data transfer methodology](./data_transfer) based on the network type.
A modeled ad format consists of:
* Image assets: When modeling ad formats this includes all images that are downloaded on initial render and would include hero images, cover images, video first frames (for videos that do not autoplay) and logos. When a format is multi-image e.g. a carousel or story ad, if the format require user interaction to scroll then only the images visible on initial render are included. If the format autoplays then we ask for an average of the number of images used in the format.
* Video assets: any video asset used to display the creative. Video assets are characterized by duration (the total length of the video) and bitrate (480P, 720P, or 1080P).
* Additional Static assets: HTML, fonts, Javascript and CSS, SDK compiled code, and AR overlays. Does not include any advertiser-provided tags, trackers, or images/videos that were previously added.
Some video players will stream video content, buffering a few seconds ahead of the user's position. We model streaming players using `min(placement average view time + buffer, duration) x min(default bitrate)`. For instance, a 15s creative delivered through a streaming player that buffers 2s into a placement with 6s of average view time would be the equivalent of an 8s non-streaming creative.
When the out-stream video player is unknown, Scope3 will apply a non-buffering default player, and the full duration of the video format will be recognized for data transfer.
The total data transfer from a creative can be calculated as `static assets + video assets`.
### Ad Platform Emissions
For digital channels, we calculate Ad Platform emissions corresponding to the Ad Serving and Measurement processes. See the [defaults](./calculations#ad-platform-defaults) and associated [calculations](./calculations#creative-delivery-platform) used.
By default, we apply the emission factors from [GMSF 1.2](https://adnetzero.com/wp-content/uploads/2025/06/GlobalMediaSustainabilityFrameworkV1.2.pdf), which evaluate Ad Serving from a CDN/Edge Node. These emission factors are expressed per unit of data transferred from a creative.
* Use-phase energy intensity of transferring 1MB from an edge node: 4.30E-07 kWh / MB
* Embodied emissions intensity of transferring 1MB from an edge node: 5.88E-07 kgCO2e / MB
### Vendor Emissions
Measurement and verification vendors are considered to be part of the creative delivery of a format and not the ad format itself, so have been omitted from the modeling of custom ad formats.
# Data quality
Source: https://methodology.scope3.com/data_quality
Given the many layers of assumptions and allocations involved in modeling the emissions of the complex advertising supply chain, it is critical to understand the accuracy of emissions data both for assessing provider quality and as a gating factor to incorporate data into corporate and regulatory reporting.
## Data Quality Components
Each data element included in an emissions model should include:
* Grid mix data quality (1-5)
* Organization data quality (1-5)
* Ad tech platform data quality (1-5)
* Property data quality (1-5)
* Ad stack data quality (1-5)
* Ad format data quality (1-5)
In addition, it's important that the provided activity data has sufficient granularity for accurate modeling:
* Input granularity score (1-5)
## Grid mix
Grid intensity can fluctuate significantly on an hourly basis due to the variable nature of both renewable energy sources (sun, wind) and electricity demand. To achieve effective decarbonization, having hourly data is critical. However, this isn't broadly available in many countries.
| Data source and timescale | Data Quality |
| -------------------------- | ------------ |
| Worldwide | 1 |
| Country, monthly or annual | 2 |
| Country, daily | 3 |
| Country + region, daily | 4 |
| Country + region, hourly | 5 |
## Organization
Criteria for accurate sustainability data at the organization level:
* An organization should provide a sustainability report that details its full carbon footprint, including scopes 1, 2, and all scope 3 categories. This report should clearly detail methodology for each category.
* Any adjustments to the calculations for RECs, PPAs, offsets, or carbon credits should detail exactly what was purchased, from whom, and on what timeframe. Location-based scope 2 data should always be provided.
* A sustainability report should be published within 6 months of the end of the previous calendar year to be considered for sustainability purposes.
| Report element | Data Quality |
| ------------------------------- | ------------ |
| Scope 1 and 2, market-based | +1 |
| Location-based scope 2 | +1 |
| All scope 3 categories provided | +1 |
| Lines of business broken out | +1 |
## Ad tech platforms
Any ad tech platform (SSP, DSP, media selling platform, traffic shaping technology etc.) should provide data in the following three categories:
* Supply - What ad inventory they have access to and how they integrate with publishers
* Requests Handling - How much carbon emissions are produced to handle an ad request
* Traffic Shaping - How they integrate with downstream demand partners (so we can better estimate their “secondary” emissions)
The quality score for each group starts at 1 and increments based on the presence of below data elements.
| Supply Quality Score | Data Quality |
| -------------------------------------------------------------------------------------------------- | ------------ |
| Inventory List Provided | +1 |
| Total Request per Inventory ID | +1 |
| Above data broken down by at least 1 additional dimension (placement, country, channel, seller ID) | +1 |
| Data is shared monthly | +1 |
| Request Quality Score | Data Quality |
| ----------------------------------------- | ------------ |
| Server Emissions | +1 |
| Total Bid Requests | +1 |
| Above data broken down by server location | +1 |
| Organization data quality ≥ 3 | +1 |
| Traffic Shaping Quality Score | Data Quality |
| -------------------------------------------------------------------------------------- | ------------ |
| Ratio of ad requests processed vs bid requests sent for each integrated demand partner | +1 |
| Above data broken out by inventory ID | +1 |
| Above data broken out by country | +1 |
| Data is shared monthly | +1 |
For DSPs, real time data providers might be used instead of “demand partners” under Traffic Shaping Quality Score.
## Property
### Web, App, Social, CTV and Digital Audio properties
For web, app, social, CTV and digital audio media properties, the three key metrics include session time, session weight, and ad load.
These metrics can be extrapolated from other publicly shared metrics (such as Monthly Active Users, Revenue, etc.), or estimated by 3rd party tools that employ panels (such as SimilarWeb). They can also be observed through crawling and scraping, or measured directly by the publisher through tools like Google Analytics.
| Property Metrics | Example Data Source | Data Quality |
| ------------------------------- | ------------------------------- | ------------ |
| Not available | N/a | 1 |
| Extrapolated from other metrics | Yearly Financial Report | 2 |
| 3rd party estimated | Panels | 3 |
| Observed | Controlled Crawling or Scraping | 4 |
| 1st party measured | Publisher Analytics | 5 |
Each key metric’ data quality is evaluated separately, then the property’ data quality score is the lower closest integer (floor) of the sum of each key metric’ data quality score divided by 3.
Example:
| Metric | Example Data Source | Data Quality |
| -------------- | ------------------------------------ | ------------ |
| Session time | SimilarWeb | 3 |
| Session weight | SimilarWeb | 3 |
| Ad load | Publisher’ Google Ad Manager account | 5 |
Property data quality score: (3+3+5) / 3 = 3.67 ⇒ 3
### DOOH screens
For DOOH screens, the key metric is power draw.
It can be acquired on a per screen basis, for example using a power metre, or can be estimated using using screen size or manufacturer specifications.
| Property Metrics | Granularity | Data Quality |
| -------------------------------------------------------- | ----------------- | ------------ |
| Not available | N/a | 1 |
| Extrapolated based on physical dimensions and venue type | N/a | 2 |
| Derived from manufacturer’ specifications (typical draw) | N/a | 3 |
| Observed from energy bills or measured through metres | Monthly or Yearly | 4 |
| Observed from energy bills or measured through metres | Hourly | 5 |
## Ad Stack
The accuracy of the ad stack used by the publisher for the placement depends on accurate representation of all direct and indirect ad platforms. The ad stack score starts at 1 and increments based on provided data components.
| Ad Stack Component | Data Quality |
| ------------------------------------------------- | ------------ |
| Ad stack mapped via observed data | +1 |
| Ads.txt validated | +1 |
| Ad platforms mapped to region, device, and format | +1 |
| Placements mapped to GPID and ad platform | +1 |
## Ad Format
The ad format data should include all of elements included upon the initial render of the ad format. Advertiser-provided assets should be identified so that they can be replaced with actual data during the measurement process. All ad platforms that are part of the rendering process should be included, especially ad servers, real-time measurement providers, and video players.
| Ad Format data element | Data Quality |
| ------------------------------------------------------------- | ------------ |
| Technical specs provided | +1 |
| Media assets identified | +1 |
| All static assets measured and included | +1 |
| Video player is identified and has data quality of at least 3 | +1 |
## Input granularity
Provided inputs must match the underlying model in order to provide accurate output. For instance, if the user provides "ANZ" as a country, that might not match "AU" or "NZ", causing a mapping issue that could cause a fallback to using worldwide grid mix and a significant loss of accuracy.
Granularity % is the percentage of recommended input fields that are provided and match valid values.
### Recommended input fields
| Field | Comments |
| ---------------------- | ------------------------------------------------------- |
| Property | |
| Placement | |
| Seller | |
| Country | |
| Region | For countries with multiple grid regions, eg US, CA, AU |
| Device Type | |
| Network | |
| Date | |
| Time | At least hourly granularity |
| Ad format | |
| Creative asset weights | |
### Input granularity to data quality map
| Granularity % | Data Quality |
| ------------- | ------------ |
| \< 30% | 1 |
| 30% - 50% | 2 |
| 50% - 70% | 3 |
| 70% - 90% | 4 |
| 90% - 100% | 5 |
### Input granularity example
| Field | Provided Input | Match |
| --------------- | -------------- | ----- |
| Property | nytimes.com | yes |
| Placement | (omitted) | no |
| Seller | Google AdX | no |
| Country | US | yes |
| Region | (omitted) | no |
| Device Type | Phone | yes |
| Network | (omitted) | yes |
| Region | (omitted) | no |
| Date | 2024-04-01 | yes |
| Time | (omitted) | no |
| Ad format | 320x50 banner | yes |
| Creative weight | (omitted) | no |
Input granularity percentage: 6/12 = 50%
Input granularity score: 2
# Data transfer
Source: https://methodology.scope3.com/data_transfer
# Emissions from Data Transfer
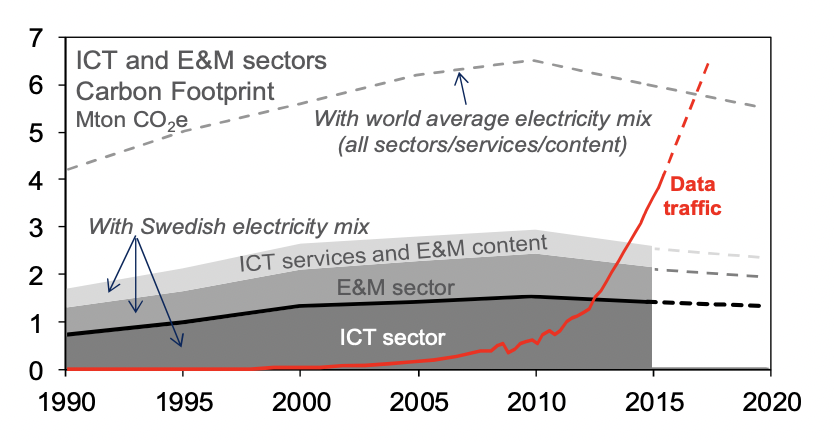 As a sanity check on the total environmental impact of network infrastructure, this paper: [The electricity consumption and operational carbon emissions of ICT network operators](https://www.diva-portal.org/smash/get/diva2:1177210/FULLTEXT01.pdf) uses confidential information provided by network operators to produce an estimate of the total and per-subscriber emissions.
> * The total annual operational carbon emissions of the ICT networks are estimated to 169 Mtonnes CO2e for 2015. This corresponds to 0.53% of the global carbon emissions related to energy (about 32 Gtonnes), or 0.34% of all carbon emissions (about 50 Gtonnes).
> * The total annual operational electricity consumption of the overall ICT networks globally is estimated to 242 TWh for 2015 including both grid (215 TWh) and on-site generated electricity (27 TWh). The total corresponds to 1.15% of the total electricity grid supply.
The paper shows that electricity use and emissions per subscriber are relatively flat over the period 2010 to 2015 due to increased efficiency of the underlying technology (Moore's law), and demonstrates that electricity use and emissions are not growing proportionately to data transfer, which grew dramatically over this period.
The paper calculates emissions per fixed broadband (37 kgCO2e/sub) and mobile (14 kgCO2e/sub) subscribers, with an average of 19 kgCO2e per subscriber.
The same author, Jens Malmodin, produced a graphic showing the sources of power usage per user at the [Science & Society Forum](https://www.youtube.com/watch?v=Xo0PB5i_b4Y\&t=2520s) in Sweden in 2020:
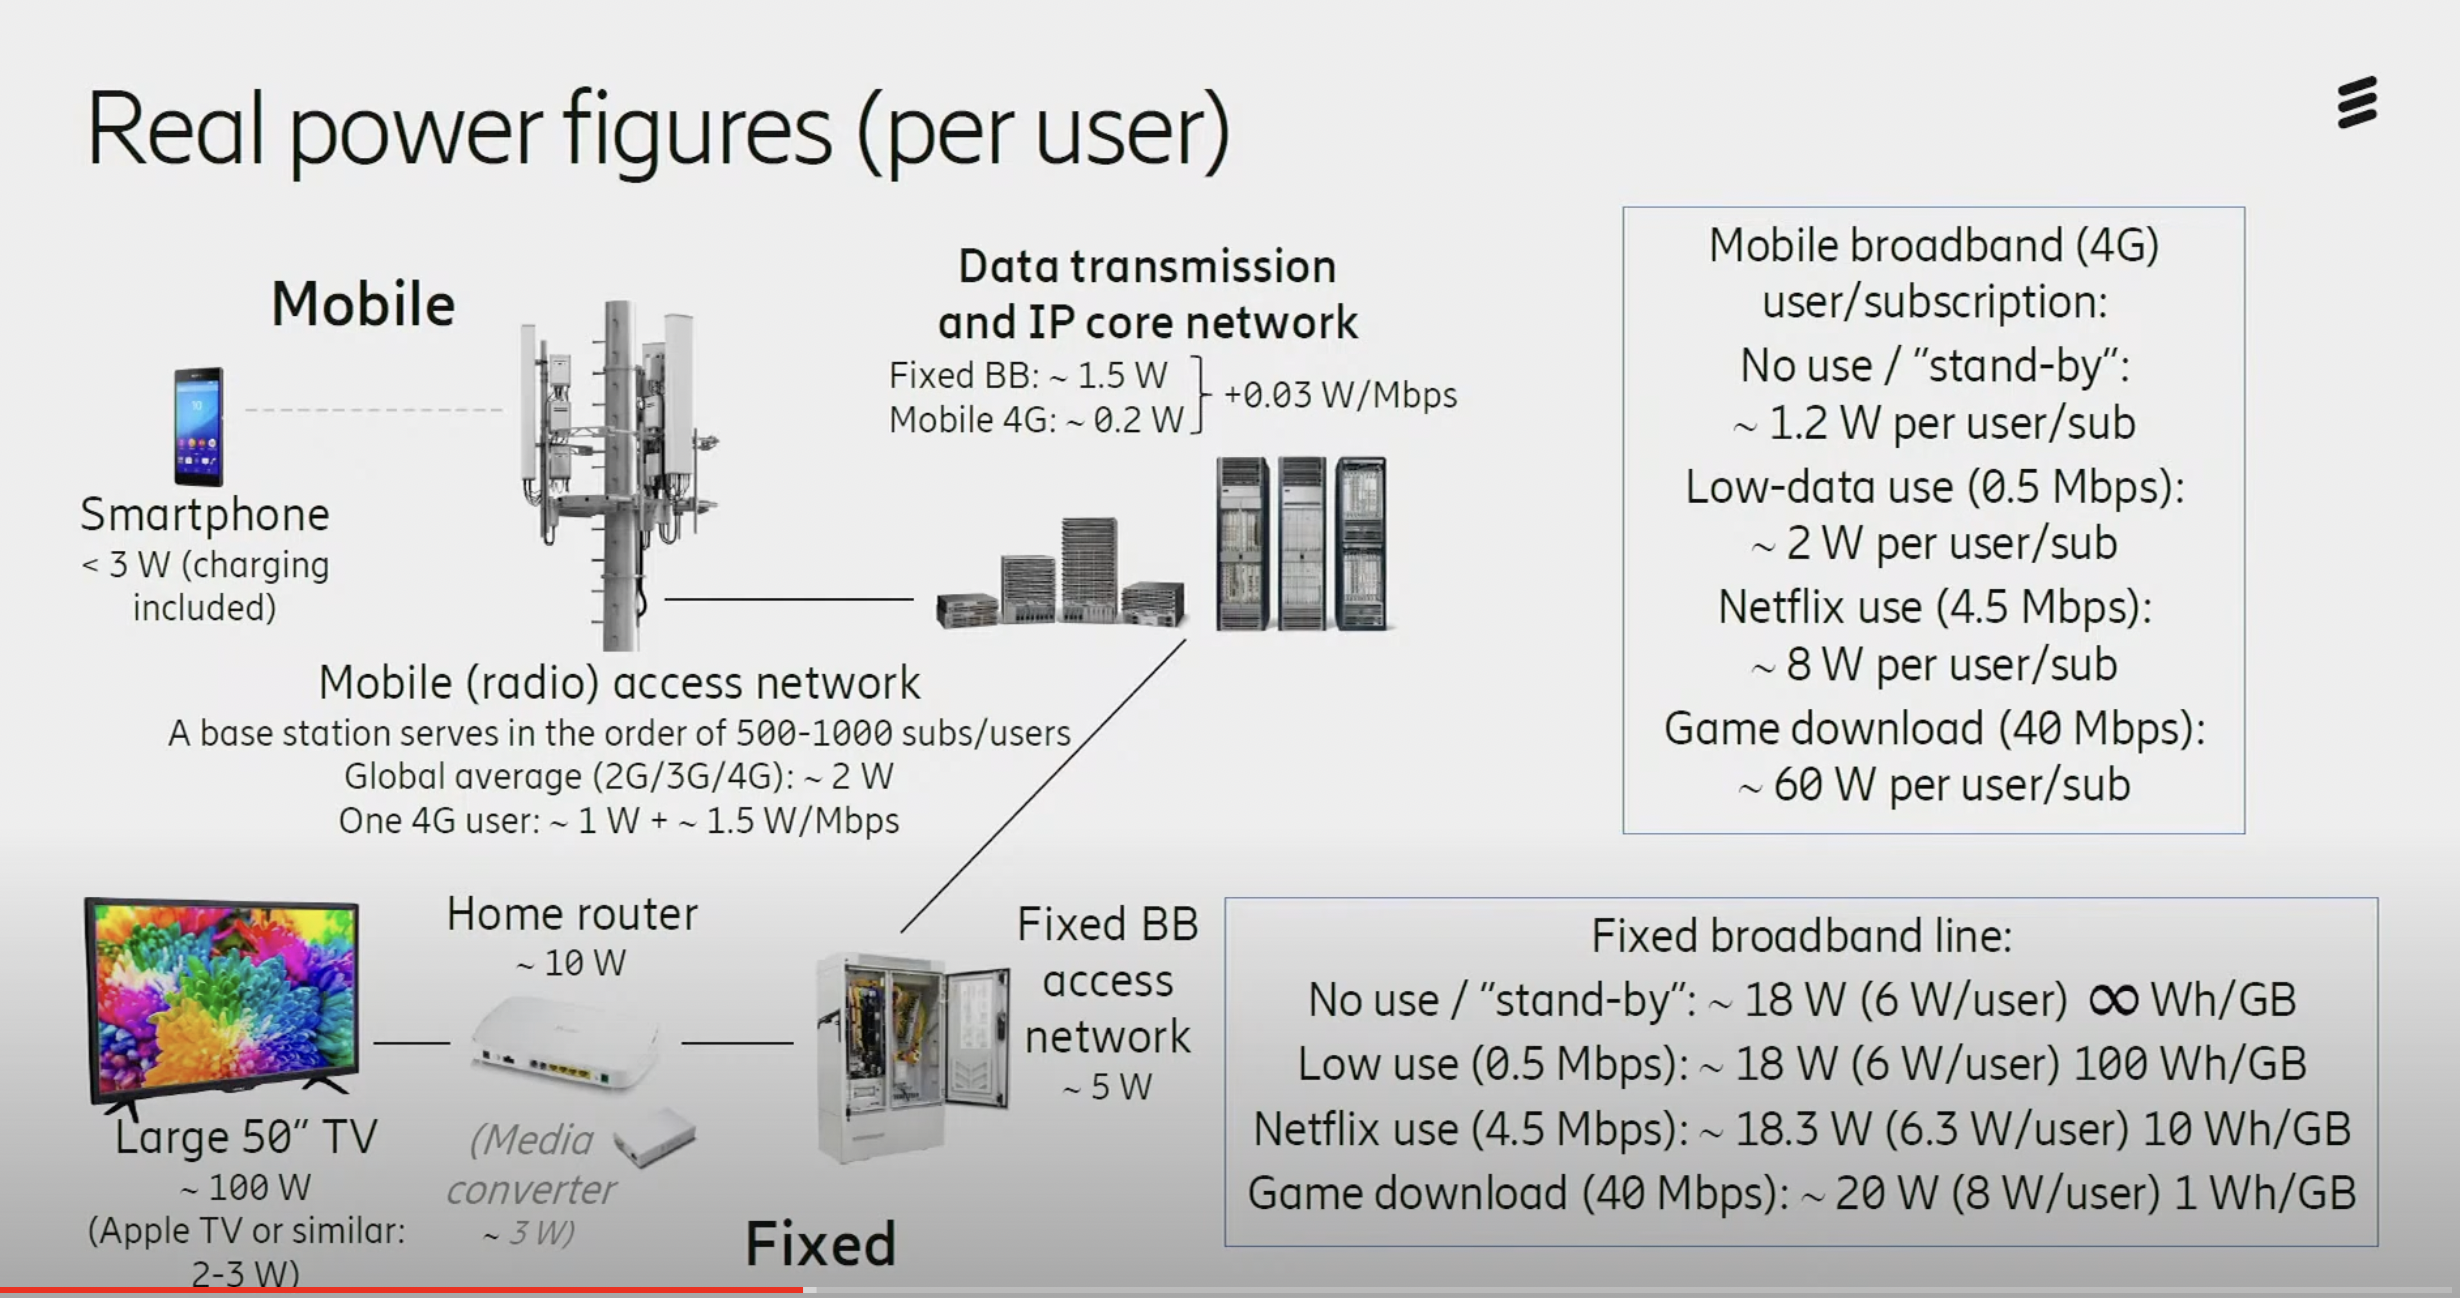 These bottom-up numbers indicate that the majority of emissions from broadband users are fixed and change little based on data transfer, while mobile emissions are somewhat based upon data transfer (presumably because the access network uses energy to transmit more actively). An expansion of this analysis that compares to other assessments of emissions from network use can be found in *IEA (2020), [The carbon footprint of streaming video: fact-checking the headlines](https://www.iea.org/commentaries/the-carbon-footprint-of-streaming-video-fact-checking-the-headlines), IEA, Paris*
### References and articles:
* As a starting point in understanding all the various approaches for understanding the carbon footprint of various networks, we recommend [this article by Gauthier Roussilhe](https://gauthierroussilhe.com/articles/explications-sur-l-empreinte-carbone-du-streaming-et-du-transfert-de-donnees).
* [Base Station Energy Use in Dense Urban and Suburban Areas](https://ieeexplore.ieee.org/document/10005276?source=authoralert) includes a table of the base station (RAT) energy use for 3G, 4G, and 5G with 2.8, 0.104, and 0.0104 kWh/GB respectively
* [Power consumption evaluation of mobile radio access networks using a bottom-up approach](https://hera.futuregenerations.be/sites/www.futuregenerations.be/files/summary_masterthesis4g5g_louisgolard.pdf) proposes 10 kbit/J for 4G base stations, equivalent to 0.23 kWh/GB. It suggests 5G is 3-4x more efficient, approximately 0.06 kWh/GB.
* For mobile vs fixed data the [2020 EU ICT impact study](https://circabc.europa.eu/sd/a/8b7319ba-ce4f-49ea-a6e6-b28df00b20d1/ICT%20impact%20study%20final.pdf) suggests 0.03 kWh/GB for fixed, 0.14 kWh/GB for mobile.
* The 0.03 kWh/GB number aligns with what is in the graphic above (0.03 W/Mbps) at relatively low bandwidth. [Aslan et al](https://onlinelibrary.wiley.com/doi/10.1111/jiec.12630) suggest that fixed-line networks should be 0.06 kWh/GB in 2020 and halving every two years. This is consistent with the 0.03 kWh/GB figure.
* Per DIMPACT methodology, "Range 0.1 – 1.0 kWh/GB (2020). After review of the available data the Carbon Trust used a value of 0.1 kWh/GB based on [Pihkoka et al](https://www.mdpi.com/2071-1050/10/7/2494) in their Whitepaper ‘Carbon impact of video streaming’ (2021)"
* Greenspector has a highly detailed analysis of the impact of data transfer [here](https://greenspector.com/en/what-impact-does-the-network-have-on-digital-services/).
* Malmodin J, Lundén D. [The Energy and Carbon Footprint of the Global ICT and E\&M Sectors 2010–2015](https://doi.org/10.3390/su10093027). Sustainability. 2018; 10(9):3027.
## Power usage and embodied emissions by bandwidth (Conventional Model)
We apply the conventional model to all channels.
The [GMSF 1.2](https://adnetzero.com/wp-content/uploads/2025/06/GlobalMediaSustainabilityFrameworkV1.2.pdf), the latest "official" industry source, uses ADEME emission factors based on a this [study on the environmental footprint of French ISPs](https://librairie.ademe.fr/industrie-et-production-durable/6789-evaluation-de-l-empreinte-environnementale-de-la-fourniture-d-acces-a-internet-en-france.html#product-presentation). Although based on primary and recent data (2023) the values are unfortunately not time-adjusted or adapted to different markets.
The initial ADEME work considers two components to calculate network-related electricity consumption for both fixed and mobile networks:
* Component `a` (dynamic): models the consumption of the network infrastructure per amount of transferred data, expressed in kWh per MB.
* Component `b` (static): models the consumption of the network infrastructure per user.
To derive a conversion factor per unit of data transferred that combines the two components, the GMSF makes some assumptions regarding the average bandwidth:
* 2.88 GB per hour for fixed networks (from the [Carbon Trust](https://ctprodstorageaccountp.blob.core.windows.net/prod-drupal-files/documents/resource/public/Carbon-impact-of-video-streaming.pdf) study)
* 2.19 GB per hour for mobile networks (from Greenspector)
The same approach is applied for embodied emissions. The resulting conventional model uses the following emission factors:
| Emission factor | Unit | Value |
| ------------------------------------------ | ------------- | ---------- |
| Electricity consumption of mobile networks | kWh per MB | 0.000117 |
| Embodied emissions of mobile networks | kgCO2e per MB | 0.0000087 |
| Electricity consumption of fixed networks | kWh per MB | 0.0000165 |
| Embodied emissions of fixed networks | kgCO2e per MB | 0.00000214 |
## Power usage by time and bandwidth (Power Model)
**Note**: We have deprecated the use of the Power Model to align with GMSF 1.2. The information below is valid only for CTV‑BVOD and OLV measurements conducted before October 2025.
Per [Carbon Trust](https://ctprodstorageaccountp.blob.core.windows.net/prod-drupal-files/documents/resource/public/Carbon-impact-of-video-streaming.pdf):
This white paper presents a power model approach, which uses a marginal allocation methodology, where a baseload power is allocated per user, and a marginal energy component is allocated related to the data volume used. The power model approach recognises that the dynamic relation of energy to data volume in a network is very flat – i.e. there is a high fixed power baseload which does not vary in relation to the data volume, with only a small increase in power consumption in response to the data consumption.
### Fixed Network
Assumptions (see Table 5 in Carbon Trust doc):
* We diverge from Carbon Trust in that we assume one active device per household member vs their assumption that half of all user devices are active - this represents multiple people watching the same TV, for instance, or streaming on a maximum of one personal device at a time (in other words, we set A = 1 and Qd = 1)
* We also do not include an idle factor as it does not make sense to us to include all of the other uses of the network, many work-related like video calls, in our calculation (in other words, we set F = 1)
* We assume an average household size of 2
Coincidentally, these assumptions basically tie out to the same number as Carbon Trust - 3x the user factor times 1/3 the idle factor
```equation theme={null}
Allocated Fixed Network Energy (Afn) = 6.5W / 2 users = 3.25W
Dynamic Fixed Network Energy (Dfn) = (0.03W/Mbps + 0.02W/75Mbps) = 0.030W/Mbps
Allocated Home Router Energy (Ehr) = 10W / 2 users = 5W
CDN = 1.3W
Fixed Network Energy = 9.55W + 0.03W/Mbps
```
### Mobile Network
We use the same numbers as Carbon Trust
```equation theme={null}
Mobile Network Energy (Amn) = 1.2W + 1.53W/Mbps
```
## Handling unknown networks
The SRI methodology suggests a ratio of 90% fixed to 10% mobile. However, this ratio is not representative globally. The ITU publishes [research](https://datahub.itu.int) on fixed and mobile traffic by country. However, this dataset notably omits the US which is likely similar to other advanced economies in the 5% range, so we have added this to the dataset as an estimate.
# Lifecycle
Source: https://methodology.scope3.com/lifecycle
# Life Cycle Analysis for Advertising
Life cycle assessment or LCA (also known as life cycle analysis) is a methodology for assessing environmental impacts associated with all the stages of the life cycle of a commercial product, process, or service. For instance, in the case of a manufactured product, environmental impacts are assessed from raw material extraction and processing (cradle), through the product's manufacture, distribution and use, to the recycling or final disposal of the materials composing it (grave). (from ["Life-Cycle Assessment"](https://en.wikipedia.org/wiki/Life-cycle_assessment) - Wikipedia).
## Life Cycle Assessment of an Advertisement
To "manufacture" an ad impression, our raw materials are media (content), creative (the ad itself), and human attention (via ears and/or eyes). Different channels will have different combinations of these ingredients. For instance, a billboard often doesn't have content, just the ad. However, a billboard will have a disposal component when the vinyl is removed or recycled.
The life cycle of an ad can be broken down into three stages: production, distribution, and disposal. The production phase includes media production and creative production. Disposal relates to recycling of newspapers or vinyl used for billboards and is not relevant for digital media. The distribution phase has three components:
1. Media distribution
2. Ad selection
3. Creative distribution at the point of consumer engagement
 ## Creative Production
The industry standard for measuring the carbon footprint of creative production is provided by [Ad Green](https://weareadgreen.org). See also [Green The Bid](https://www.greenthebid.earth) which focuses on reducing the impact of creative production.
## Media Production
The leading resource for measuring the environment impact of film and TV production in the UK is [Albert](https://wearealbert.org). Other countries have adopted or are adopting similar frameworks.
## Use Phase Methodologies
We have seen three well-documented methodologies for the use phase of media and advertising:
* [DIMPACT](https://dimpact.org/publications)
* [SRI](https://www.sri-france.org/wp-content/uploads/2021/11/SRI_Calculating-the-carbon-footprint_VF.pdf)
* [GroupM](https://www.wpp.com/en/-/media/project/wpp/images/sustainability/media-decarbonisation/groupm_mediadecarb_jul15.pdf)
* [GMSF](https://adnetzero.com/wp-content/uploads/2025/06/GlobalMediaSustainabilityFrameworkV1.2.pdf)
### Life cycle boundaries by methodology
| Topic | DIMPACT | SRI | GroupM | GMSF |
| --------------------- | ------- | --- | ------ | ---- |
| Media distribution | Yes | No | Yes | No |
| Ad selection | No | Yes | Yes | Yes |
| Creative distribution | Yes | Yes | No | Yes |
| Disposal | N/a | N/a | No | Yes |
### Channels covered
DIMPACT and SRI are digital-only. The GroupM and GMSF methodology includes both digital and broadcast channels, including TV, OOH, cinema, and radio.
### Inclusion of embodied emissions
Another key dimension to evaluate methodologies is whether they incorporate embodied emissions in each phase. To quote DIMPACT, "Use-phase emissions are those that result from the electricity and energy consumption of equipment used to process, transfer, and view content. What is excluded from this minimum boundary are the emissions from the raw material extraction, manufacturing, transport and installation of the equipment and devices used to serve and view digital content. These are known as ‘embodied emissions.'"
As an example from the SRI methodology:
 | Topic | DIMPACT | SRI | GroupM | GMSF |
| ---------------------------------------------------- | ------- | --- | ------ | ---- |
| Requires embodied emissions for consumer device | No | Yes | No | Yes |
| Requires embodied emissions for servers | No | No | Yes | Yes |
| Requires embodied emissions for networking equipment | No | No | Yes | Yes |
### Scope 2 / Electricity
The GHG Protocol provides two methods for tracking Scope 2 emissions: the market-based method and the location-based method.
* The market-based method: calculates emissions based on the electricity that organizations have chosen to purchase, often spelled out in contracts or instruments like Renewable Energy Certificates (RECs).
* The location-based method: calculates emissions based on the emissions intensity of the local grid area where the electricity usage occurs.
| Topic | DIMPACT | SRI | GroupM | GMSF |
| --------------------------------- | ----------- | --- | ----------- | ----------- |
| Requires location-based emissions | Recommended | No | Recommended | Recommended |
### Ad Tech Supply Chain
The ad tech supply chain is a critical component to understand emissions from media and advertising companies. It is opaque and has multiple layers of intermediaries, making it difficult to fully understand.
DIMPACT is omitted as its methodology does not currently include ad selection.
| Topic | SRI | GroupM | GMSF |
| ---------------------------------------------------------- | ----------- | ----------- | ----------- |
| Includes emissions from programmatic vendors | Yes | Yes | Yes |
| Includes emissions from data and identity providers | Unspecified | Unspecified | Unspecified |
| Includes emissions from technology embedded into creatives | Unspecified | Unspecified | Yes |
### Grid allocation
Since the electricity grid is interconnected across regions, reducing energy in one region can actually impact the grid mix in an adjacent region. For instance, while Quebec is fully renewable on its own, it also exports green power to New York. Reducing electricity use in Quebec allows more to be exported to New York, which allows New York to turn off a "peaker" coal plant. This methodology is *marginal* emissions. More information can be found [in this article](https://adgefficiency.com/energy-basics-average-vs-marginal-carbon-emissions/).
 None of the methodologies currently specify a preference for average vs marginal emissions.
## Further investigation
* Should we incorporate other quantitative environmental issues into these methodologies? For instance, water intensity.
# Property metrics
Source: https://methodology.scope3.com/property_metrics
# Calculating property metrics
The property represents the media upon which advertising is delivered. This could be a website, an app, a screen, a stream, or any other surface where advertising is delivered.
## Session Metrics
The first step in modeling a property is to understand a user session and how content and ads interact. The key data points to gather are 1) the average length of a session, 2) the data transferred to the consumer device to deliver content (exclusive of ads), and 3) the number of ads that are displayed during the session.
### Boundaries and non-advertising business models
For a property that is funded by a mix of advertising and other business models - for instance, a financial news publisher that charges a subscription fee and serves ads - the advertiser is not responsible for the emissions related to non-advertising revenue. The emissions from media delivery should be adjusted to reflect only the percentage funded by advertising.
### Mobile apps
Mobile apps have two sources of data transfer: the download and updates of the app itself and the content consumed during each user session. For an accurate calculation of data transfer per session, multiply the total number of app updates per year per user by the average size of each download of the app and divide by the number of sessions per user per year. For instance, an app that is updated monthly and has an average download size of 4 MB would incur 48 MB per user per year of additional data transfer.
### Web sites
To calculate the average data transfer of a user session:
1. Create a table of page views for the top URLs on the site, and using an ad blocker, calculate the data transfer to load these URLs
| URL | Page Views | Data Transfer (KB) |
| ----------- | ---------- | ------------------ |
| /index | 1000 | 778.2 |
| /sports | 300 | 489.1 |
| /news/today | 500 | 1832.9 |
2. Calculate the weighted average data transfer per page view
`data_per_pv = SUMPRODUCT(page views, data transfer)/SUM(page views)`
3. Calculate the average data transfer per session
`data_transfer_per_session = data_per_pv x pvs_per_session`
# Publisher model
Source: https://methodology.scope3.com/publisher_model
# Publisher Model
Publishers (media owners, platforms, etc) tend to be complex businesses, often with thousands of employees and complex organizational structures. Publishers often own and operate properties in different countries, sometimes with joint ventures, and have multiple revenue streams.
Modeling the emissions for a single digital ad impression on a property requires three buckets of work:
* [Ad tech emissions](#computing-emissions-from-ad-tech)
* [Consumer device emissions](#calculating-consumer-device-emissions)
* [Content production](#content-production)
This model is intended to apply all digital media including web, mobile app, and CTV. DOOH should work but we have not thought through it fully. The examples below are generally built around web and need to be updated for other channels.
At the bottom of this document we list some [concerns and caveats](#caveats-complications-and-concerns).
## Visualizing the publisher model
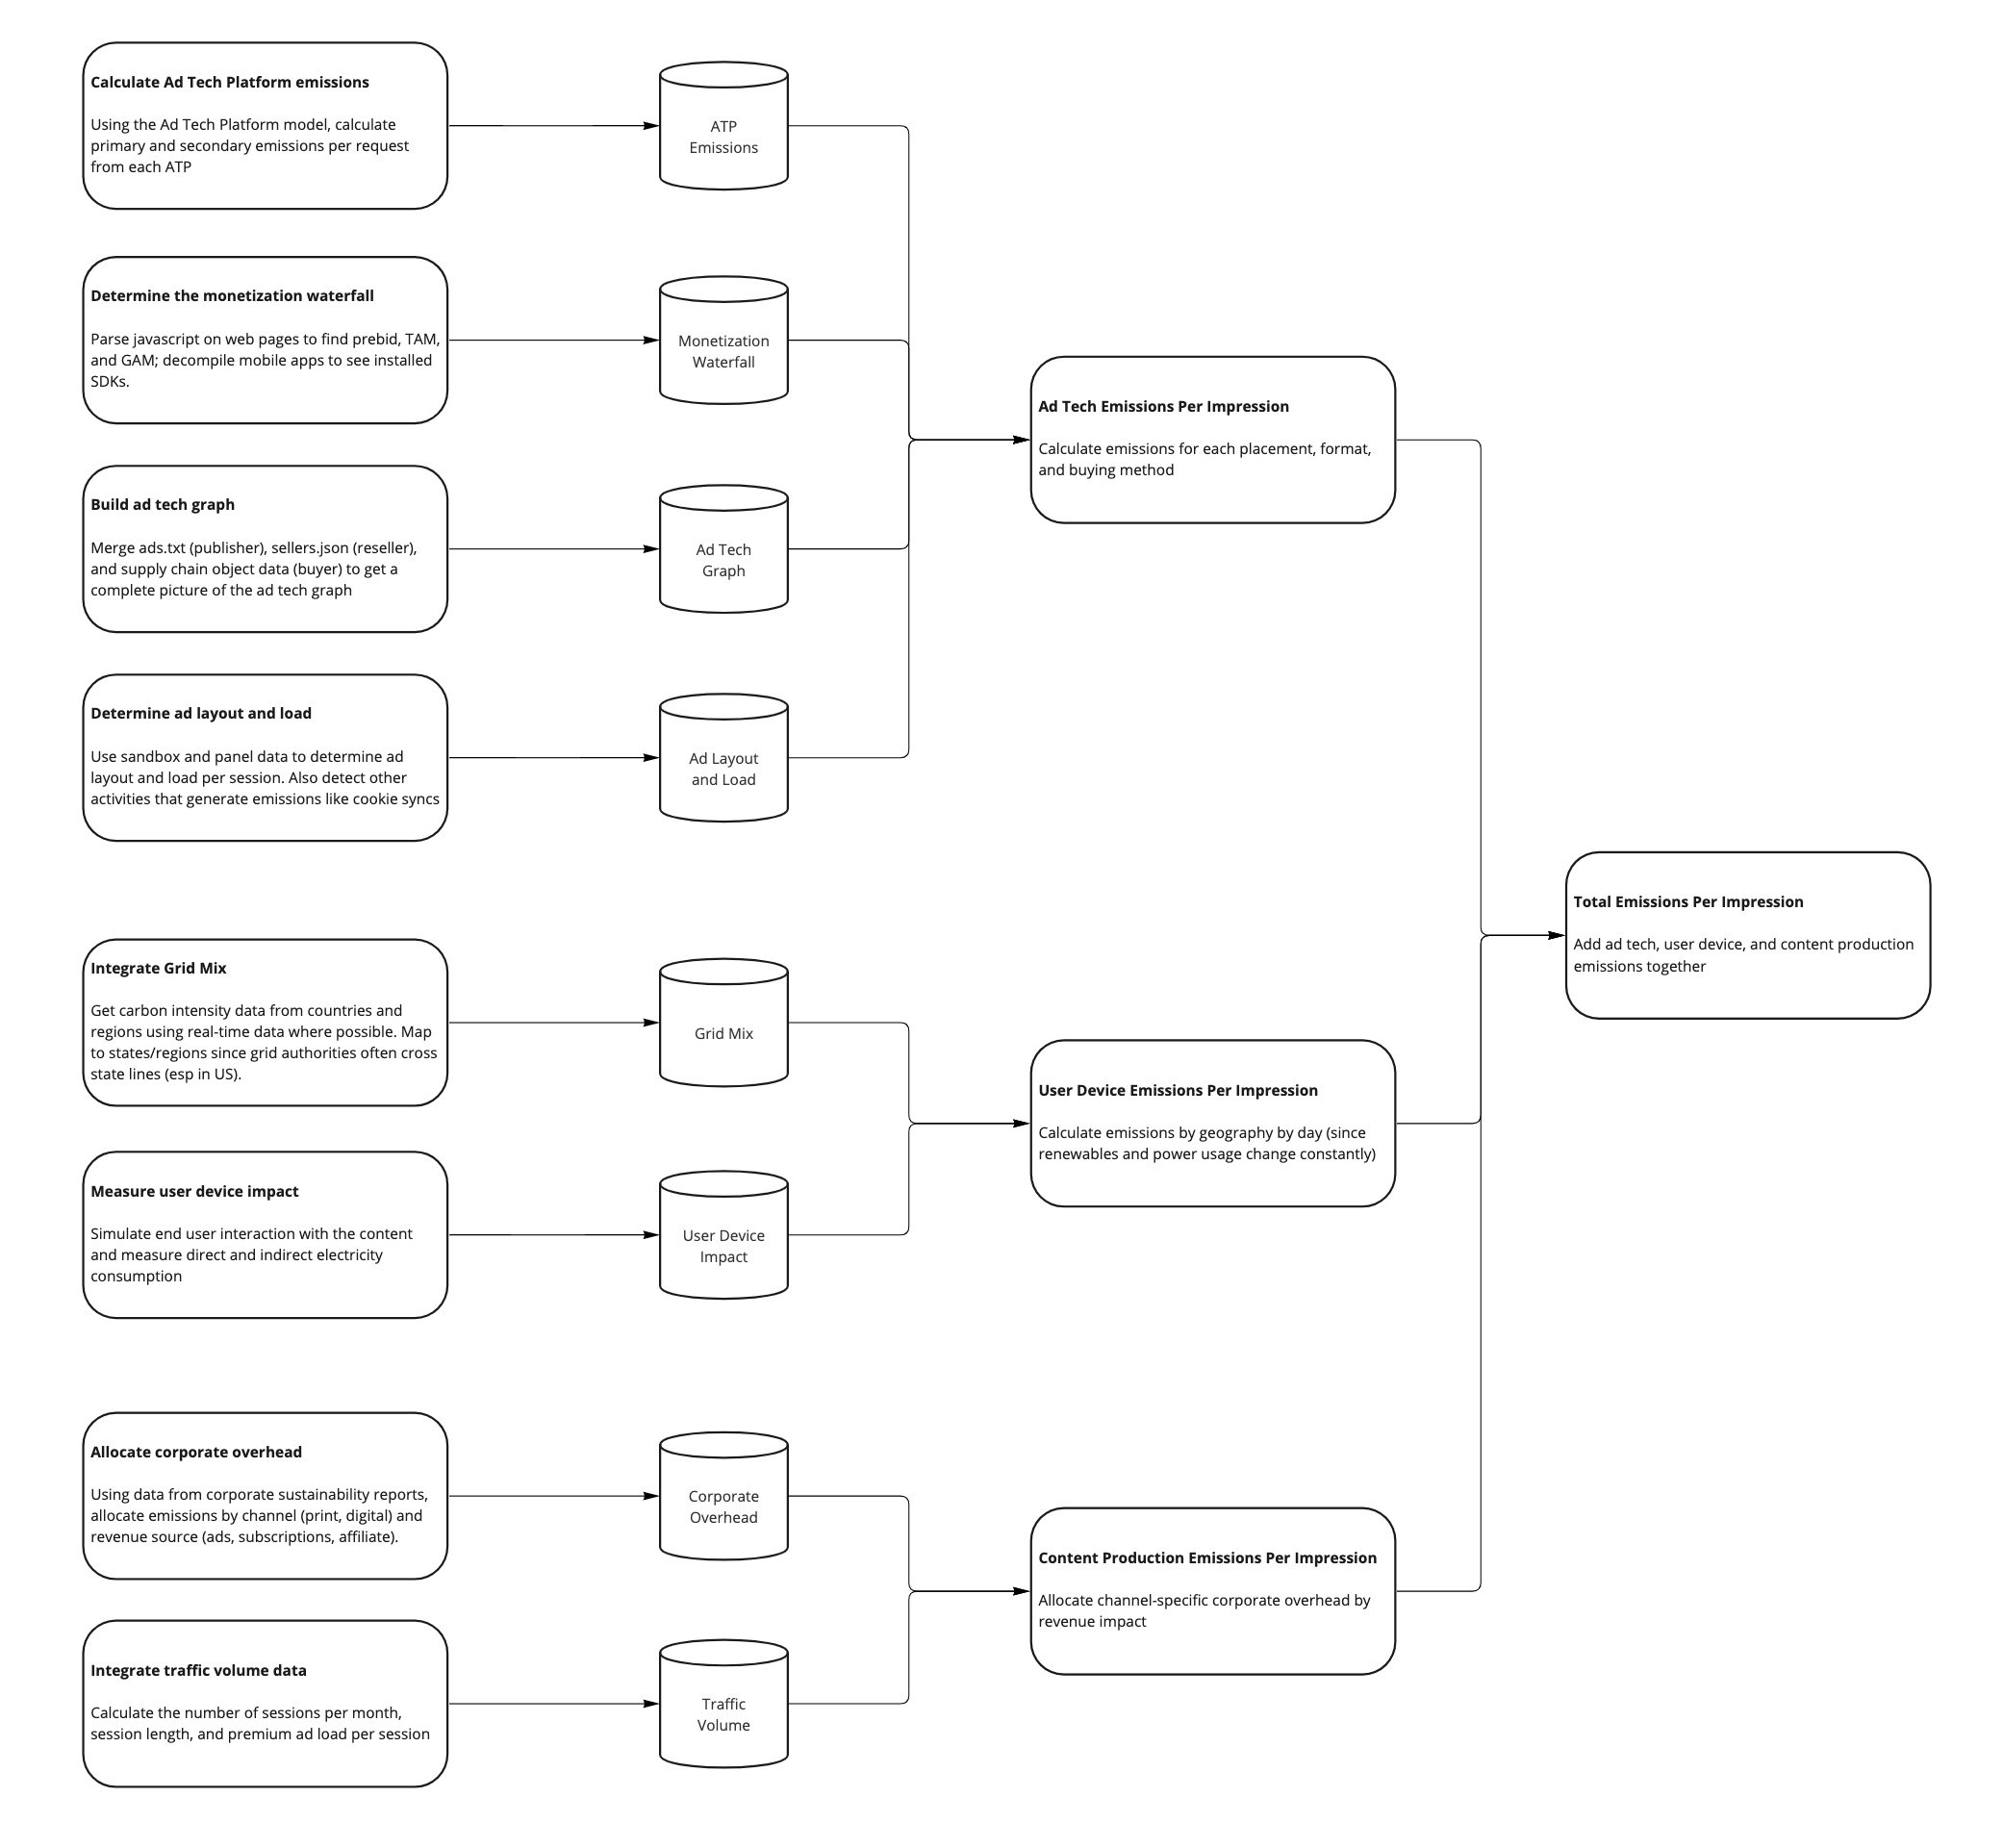 ## Computing Emissions from Ad Tech
There are three primary types of ad tech on publisher properties:
* Core delivery systems - ad serving, order management systems (OMS), and data management platforms (DMP) - are used to deliver and track the bulk of the ads delivered by a publisher
* Programmatic ad tech is used to find incremental demand for ad impressions through a real-time auction. This process generally requires synching some kind of user identification with all of the ad tech companies, driving cookie syncs and the use of a consent management platform (CMP). We represent the multi-level auction as the "ad tech graph" since all of the calls made look like a directed acyclic? graph.
* Native ad networks insert ads into the content of the page without going through the ad server. These generally also interact with the programmatic ecosystem.
When an advertiser or agency purchases an ad impression from a publisher, they generally know if the ad has been purchased directly (non-programmatically). Depending on the monetization waterfall, these impressions may interact with the core delivery systems or also with the ad tech graph. Ads purchased programmatically may operate through the ad server or be purchased from a native ad network, and the buyer may not know which thanks to the obfuscation of the programmatic ecosystem.
We model ad tech in three steps:
1. Determine the waterfall used by the publisher so we can differentiate direct buys from programmatic buys, including the number of auctions run at each stage
2. Determine the ad tech graph
3. Use the [Ad Tech Platform Model](./ad_tech_model) to determine emissions for each ad tech platform
### The Monetization Waterfall
When publishers determine which ad to display to a user they generally have a priority system that can be visualized as a waterfall. First, serve a sponsorship (or guaranteed, or programmatic guaranteed) campaign if one is eligible to deliver. If not, the impression spills over to an auction where the highest value impression wins. There is often a third tranche where mediation will occur, which can be thought of as a daisy chain of ad networks. Finally, a house or public-service ad will act as a default if nothing else can deliver.
In recent years, many publishers have adopted a unified yield strategy which runs the auction process before the sponsorship phase, enabling a high bid to preempt the sponsorship from serving.
From a sustainability perspective, most of the emissions from ad tech happen during the auction phase. In the waterfall model, serving a sponsorship involves a few technology partners for the publisher (the ad server and DMP) and a few for the advertiser (their ad server and brand safety provider). In the unified yield model, every ad tech platform will engage to try to bid on the impression, making a sponsorship just as costly from an emissions perspective as a programmatic campaign.
Many web publishers run multiple auctions on a single impression. The first auction is often Prebid.js running client-side, then one or more server-side auctions like Amazon's TAM. Then the impression is passed to Google Ad Manager (GAM) which calls into its Open Bidding layer. Each of these auctions makes requests to multiple ad tech platforms (SSPs, ad networks, and/or exchanges), most of which will then make requests to other ad tech platforms.
To understand how publishers interact with ad tech platforms, we need to know how many auctions they run and how these interact with each other and with the priority in the ad server. Generally, information about the monetization waterfall is not available in ads.txt or app-ads.txt. For websites, we can scan the code of the page to see client-side auctions like Prebid.js. For apps and server-side auctions, we need to get this information from publishers or make a best guess based on typical configurations.
### Mapping the ad tech graph
We use ads.txt to understand the direct and indirect ad tech platforms in the graph. There is risk here that publishers will not put all of their vendors in the ads.txt file, and we are relying on the increased enforcement from the programmatic ecosystem to make sure that these files are correct. We also strongly recommend that buyers stop purchasing "masked" inventory where the publisher or supply chain are obfuscated.
Ads.txt file have a number of issues, including the lack of a geographic indicator. Publishers often share the same ads.txt file across multiple domains, which causes problems if each domain has a different publisher ID for a particular ad tech platform (it will look like that ATP is called multiple times on every domain, instead of once per domain). At Scope3, we have a secondary set of filters that we use to manually clean up this information, and we also work with publishers directly to make this as accurate as possible.
### Determining programmatic auctions
One challenge is understanding how many auctions a publisher operates. We can scan the code on a page to see, for instance, Prebid.js code. However, we can't tell from the client side whether a publisher is using Google Open Bidding inside of GAM, or if they are running server-side auctions through Prebid Server or Amazon's TAM.
## Calculating Consumer Device Emissions
To calculate the emissions from the consumer side of the media experience, we need to understand:
* Emissions from the device being used to consume media
* Emissions from networking between the consumer device and the edge of the internet
* Emissions to get data from the core internet to the edge
* Grid mix at the consumer location
### Consumer behavior and devices
One of the challenges we face is that advertisers generally do not know if a consumer is using a laptop or desktop. Some ad tech platforms provide data on computer vs tablet vs phone, and in the TV space, we may know whether we are working through a set-top box, smart TV, or a media gateway. However, we are unlikely to know whether the consumer is on wifi or ethernet, whether they are using a large TV or a small one, whether they have a monitor attached to their computer, and so forth.
To best understand energy use across the various parts of a media property, we would want to sample user sessions and replicate their device and behavior. At Scope3, we license a consumer panel with 5M user devices that lets us simulate this at least to some degree of accuracy.
For purposes of this open-source model, a simpler way to get the basic data about a website is to use [Pingdom](https://tools.pingdom.com), which will scan a page of a site and provide basic metrics about page size, network requests, and load time (question: does this properly bypass cookie banners? If not, it understates emissions significantly). We can combine this data with the SimilarWeb data about pages per visit to estimate the time spent actively rendering a page and the time spent reading the content.
### Measuring energy use of consumer devices
To calculate the *Lifecycle Emissions Per Second of Use* (LEPS), we multiply the grid intensity of the consumer's location (GI) and the power draw of the consumer device (UEPS) and add this to the production energy per second (PEPS).
`LEPS = PEPS + GI • UEPS`
See [consumer device emissions](./consumer_devices) for details on how we calculate the UEPS and PEPS for each device type.
We multiply the LEPS by the average session time for each property to find the lifecycle emissions per session.
As an example, SimilarWeb shows [BZ](https://www.similarweb.com/website/bz-berlin.de/#overview) as having average visit duration of 120 seconds. For a personal computer with a power draw of 53.2 watts and a grid intensity of 500 gCO2e/kWh, we calculate use energy of 0.0073 gCO2e/s. Added to the production emissions of 0.007 gCO2e/s, we get a total of 0.0143 gCO2e/s. For a 120 second session, that would be a total of 1.716 gCO2e, which we would then divide by the number of ads seen.
### Assessing the carbon footprint of network traffic
See [Emissions from data transfer](./data_transfer).
### Grid mix
There are (at least) two companies that provide grid mix data for a broad range of companies and regions: [Electricity Map](https://electricitymaps.com) and [Watt Time](https://www.watttime.org). Each of these can provide data on the current and historical carbon intensity of the electricity grid. They use slightly different methodologies (Electricity Map uses average intensity; Watt Time is marginal intensity) and have different coverage areas. In both cases, it is necessary to map from grid regions to administrative regions (states and provinces) in countries like the US.
At Scope3, we subscribe to Watt Time and use their API; in this open source repo you can pass the carbon intensity into the model on the command line.
## Corporate Emissions
The final part of the publisher model is to allocate corporate overhead - representing the emissions from content production, monetization, and marketing - to each impression.
We do this by calculating corporate emissions per month and dividing by the number of ads per month.
### Calculating corporate emissions
See [Corporate Emissions](./corporate_model)
### Allocation of corporate emissions by channel and business model
For a digital property, we attempt to allocate only the digital ad revenue for each publisher, excluding print and other channels as well as revenue from subscriptions and affiliate programs.
(TODO)
### Allocation of corporate emissions to properties
We allocate corporate emissions to properties based on relative time spent across properties. This could also be done based on raw traffic or revenue - curious if there are any standards or best practices (or opinions!) around this.
For purposes of the open source repo, we suggest using SimilarWeb to add facts to the `properties` object for `visits_per_month` and `average_visit_duration_s`. We sum these to produce total publisher time, and then assign to each property based on property time divised by total publisher time.
### Quality ads per month
We can pull session information from SimilarWeb for each of the publisher's properties to determine the number and length of sessions for each.
To determine ads per session, Scope3 uses a crawler to detect ads per page, but we have found a number of issues with this approach:
* Ad layouts can be dramatically different on a site's home page vs internal pages
* It is difficult to trigger ads in every type of content (for instance, a mobile game may only show an incentivized ad after a certain amount of playing the game)
* Our scanner is technically a bot and should not actually see ads if ad tech companies are doing their job properly
* Infinite scroll layouts are complicated to measure accurately. How far should we scroll?
* If we divide corporate emissions by the actual number of ad slots on a page, that implies that all ads are created equal. Does a tiny ad at the bottom of a long page actually contribute equally to revenue as a very prominent ad at the top?
Instead of using the actual ads we detect, we decided to use a "quality ad load" metric that represents the maximum quality ad load that a publisher can deploy in a session. Based on consultation with some major publishers, we estimate that 20% of impressions produce 60% of revenue, and that around 5 ads per page is a reasonable ad load that can produce meaningful attention. Translating these numbers into a "quality ad load," we came up with around 1 ad per 10 seconds of session length as a default for a typical news website. A similar metric for TV might be 1 ad per 133 seconds of viewing (22 30-second ads per 49 minutes).
Future state: Get an attention measurement company to open source some attention data to compute these metrics for various channels and property types
### Sample publisher YAML
This is an example of the minimal YAML that would be passed into `./scope3_methodology/cli/model_publisher_emissions.py` to produce an estimate of emissions. This does not include emissions from the ad tech supply chain.
```yaml theme={null}
---
type: publisher
company: The Guardian
properties:
- template: news_with_print
identifier: theguardian.com
facts:
- visits_per_month: 359200000
source_id: 1
- pages_per_visit: 3.35
source_id: 1
- average_visit_duration_s: 290
source_id: 1
- page_size_mb: 3.0
source_id: 2
- load_time_s: 1.89
source_id: 2
- corporate_emissions_g_co2e_per_impression: 0.017779455902004453
comment: Output of model Sept 20, 2022
- revenue_allocation_to_ads_pct: 33.3
raw_facts:
- requests_per_page: 219
source_id: 2
sources:
- id: 1
year: 2022
month: 7
url: https://www.similarweb.com/website/theguardian.com/#overview
- id: 2
year: 2022
month: 7
url: https://tools.pingdom.com/#60bbdd2e2a800000
```
To compute the emissions for publisher, then run:
```sh theme={null}
./scope3_methodology/cli/model_publisher_emissions.py -v [--corporateEmissionsG] [--corporateEmissionsGPerImp] [company_file.yaml]
```
## Caveats, Complications, and Concerns
### Unified measurement across the value chain
One of the biggest challenges of trying to produce an industry standard for measuring emissions is that each participant in the value chain often has different data about a particular impression or campaign. For instance, a publisher may know the exact geographical location of a consumer from a device's GPS, but not be able to share that data with ad tech provider or advertisers due to privacy. Similarly, Google may have a deep understanding of a consumer's device if she is on Android, but have little information for consumers using Apple devices.
The risk here is that each participant will see the impression slightly differently, making it impossible to have an actionable discussion about how to make changes in buying and monetization behavior to reduce the carbon footprint of media and advertising.
Our approach has been to create statistical averages of various inputs into the model that ensure that all emissions are captured and that decisions made based on the data will have the desired effect.
For instance, a device model for a user that we know is on a personal computer of some sort. We assume that a "personal computer" is the weighted average of electricity use of a desktop (38%), laptop (62%), and monitor (52%) based on publicly-available data. By merging these together we do lose the ability to optimize a campaign to run only against laptops, which would save significant energy. However, this is not a feature available in any advertising platform that we are aware of, and even if it were, this data would not be generally available to the ecosystem at large.
### Interaction with content
When we try to replicate consumer behavior, we need to interact with the content in basic ways - scrolling, clicking to start videos, accepting (or rejecting) cookies. These are relatively complex from a technical perspective and difficult to model in context of a "typical" session. The risk here is probably that we are underestimating the CPU and network intentsity by not interacting with the content.