Emissions from Data Transfer
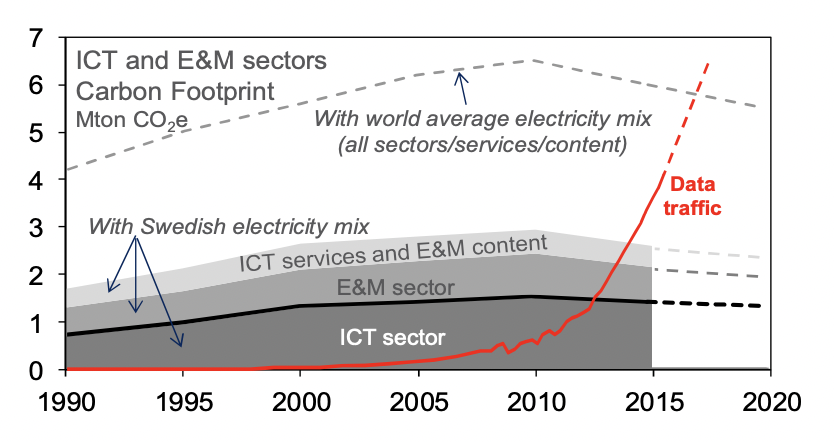
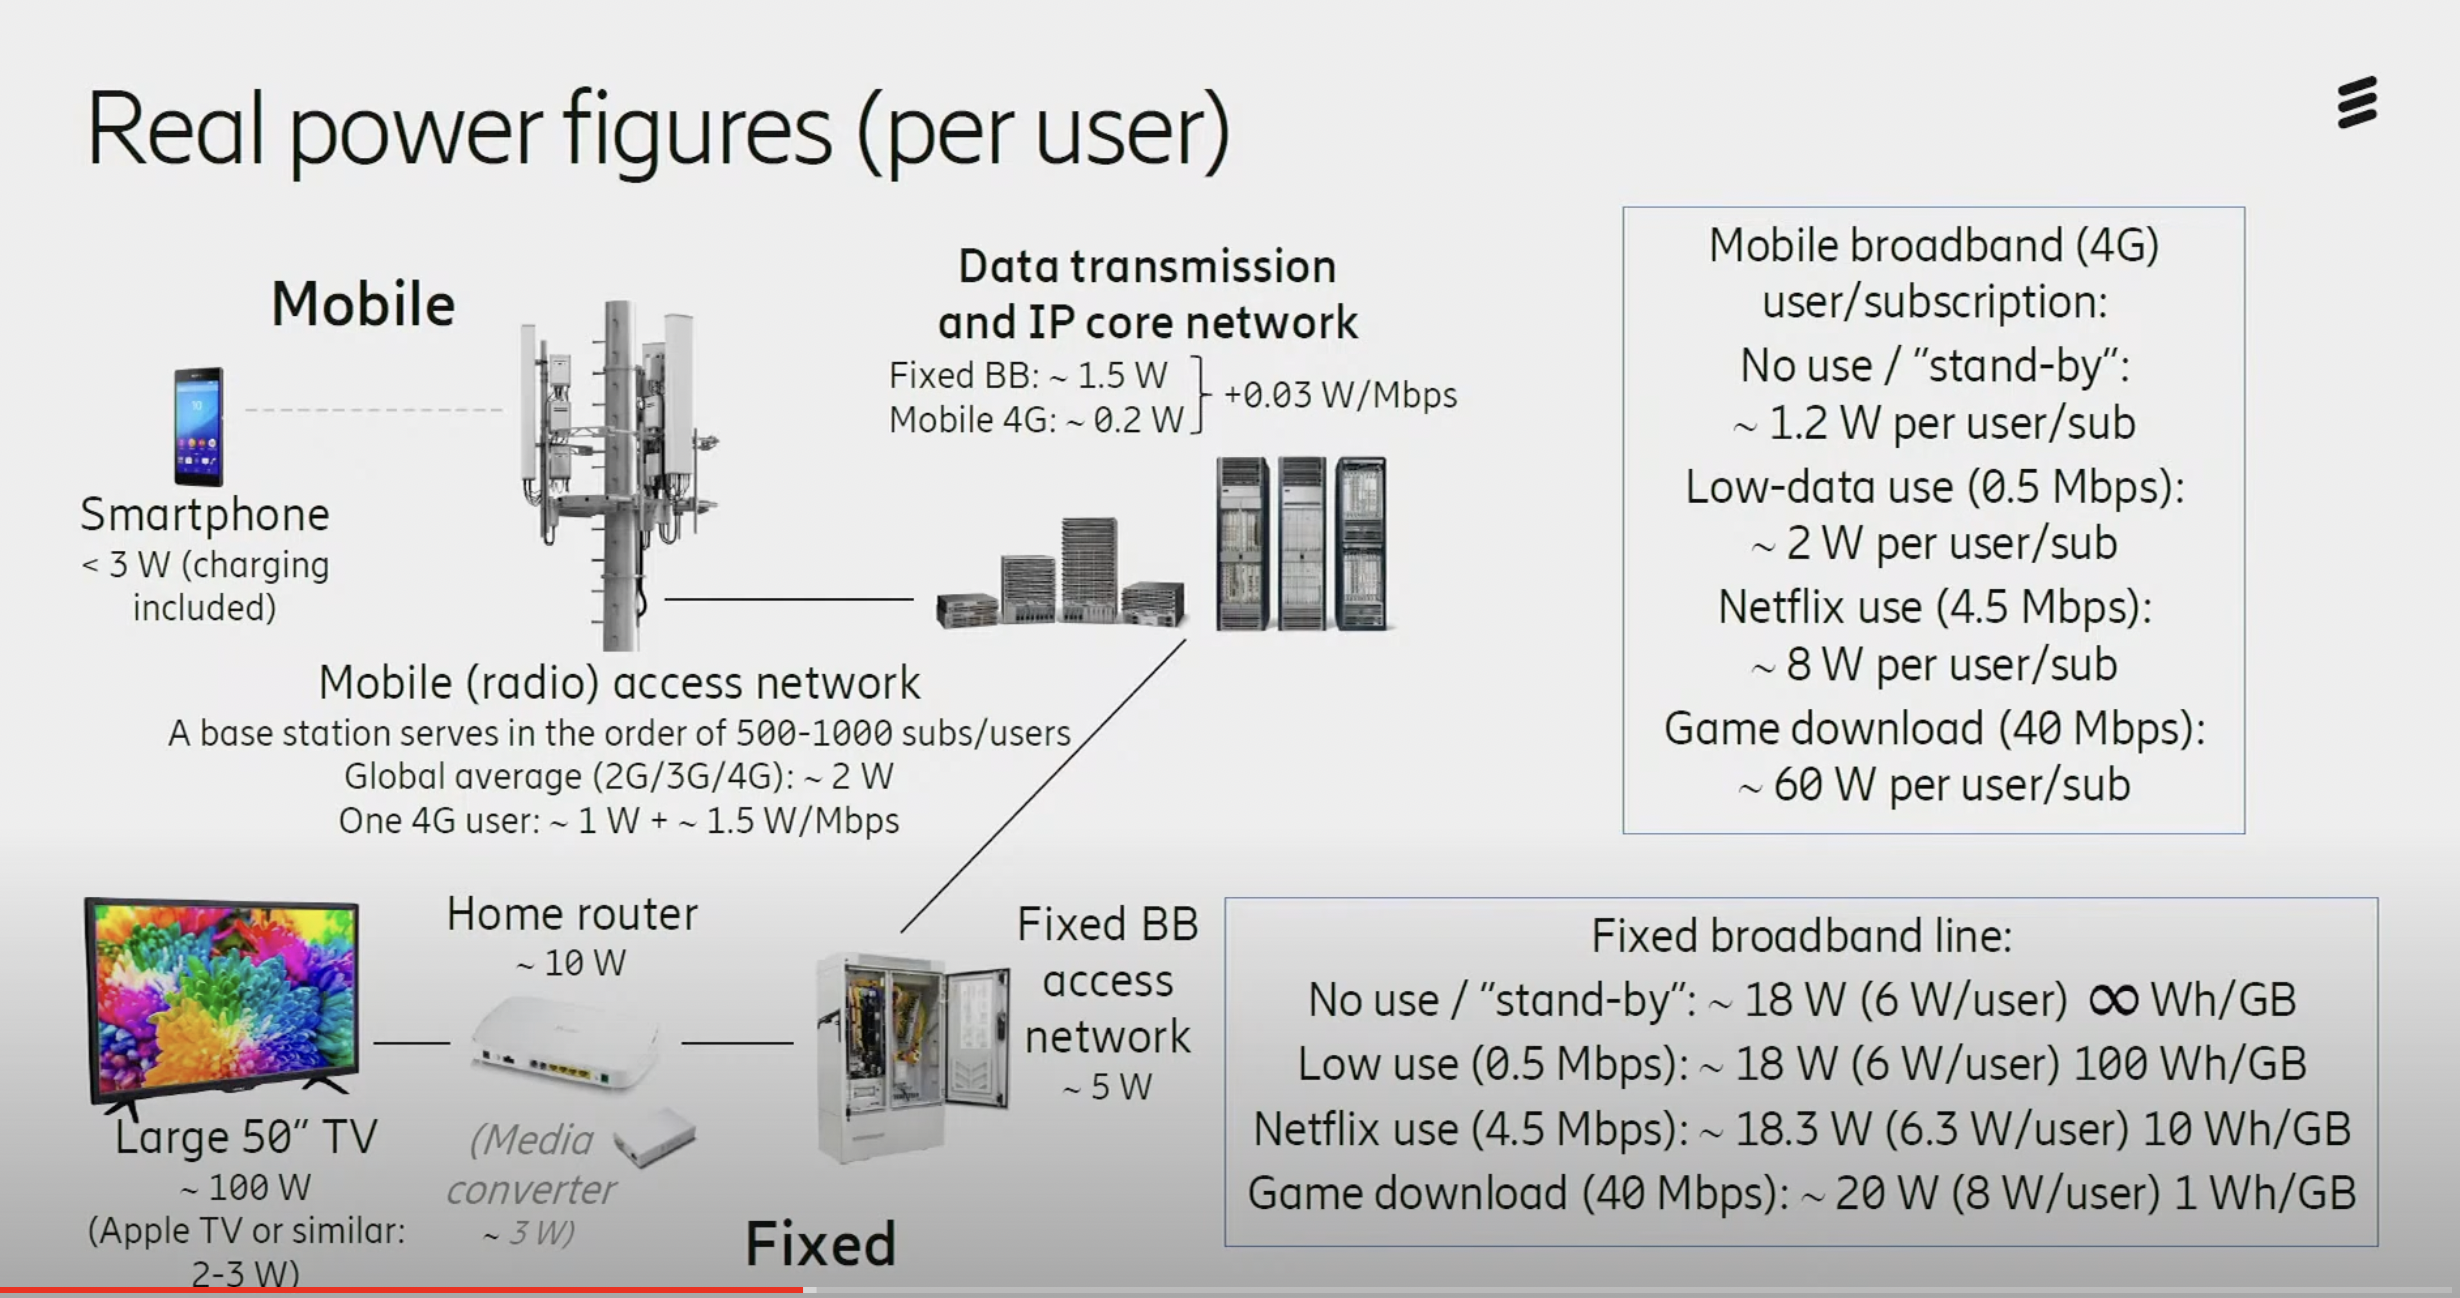
The paper shows that electricity use and emissions per subscriber are relatively flat over the period 2010 to 2015 due to increased efficiency of the underlying technology (Moore’s law), and demonstrates that electricity use and emissions are not growing proportionately to data transfer, which grew dramatically over this period. The paper calculates emissions per fixed broadband (37 kgCO2e/sub) and mobile (14 kgCO2e/sub) subscribers, with an average of 19 kgCO2e per subscriber. The same author, Jens Malmodin, produced a graphic showing the sources of power usage per user at the Science & Society Forum in Sweden in 2020:
- The total annual operational carbon emissions of the ICT networks are estimated to 169 Mtonnes CO2e for 2015. This corresponds to 0.53% of the global carbon emissions related to energy (about 32 Gtonnes), or 0.34% of all carbon emissions (about 50 Gtonnes).
- The total annual operational electricity consumption of the overall ICT networks globally is estimated to 242 TWh for 2015 including both grid (215 TWh) and on-site generated electricity (27 TWh). The total corresponds to 1.15% of the total electricity grid supply.
References and articles:
- As a starting point in understanding all the various approaches for understanding the carbon footprint of various networks, we recommend this article by Gauthier Roussilhe.
- Base Station Energy Use in Dense Urban and Suburban Areas includes a table of the base station (RAT) energy use for 3G, 4G, and 5G with 2.8, 0.104, and 0.0104 kWh/GB respectively
- Power consumption evaluation of mobile radio access networks using a bottom-up approach proposes 10 kbit/J for 4G base stations, equivalent to 0.23 kWh/GB. It suggests 5G is 3-4x more efficient, approximately 0.06 kWh/GB.
- For mobile vs fixed data the 2020 EU ICT impact study suggests 0.03 kWh/GB for fixed, 0.14 kWh/GB for mobile.
- The 0.03 kWh/GB number aligns with what is in the graphic above (0.03 W/Mbps) at relatively low bandwidth. Aslan et al suggest that fixed-line networks should be 0.06 kWh/GB in 2020 and halving every two years. This is consistent with the 0.03 kWh/GB figure.
- Per DIMPACT methodology, “Range 0.1 – 1.0 kWh/GB (2020). After review of the available data the Carbon Trust used a value of 0.1 kWh/GB based on Pihkoka et al in their Whitepaper ‘Carbon impact of video streaming’ (2021)”
- Greenspector has a highly detailed analysis of the impact of data transfer here.
- Malmodin J, Lundén D. The Energy and Carbon Footprint of the Global ICT and E&M Sectors 2010–2015. Sustainability. 2018; 10(9):3027.
Power usage and embodied emissions by bandwidth (Conventional Model)
We apply the conventional model to all channels. The GMSF 1.2, the latest “official” industry source, uses ADEME emission factors based on a this study on the environmental footprint of French ISPs. Although based on primary and recent data (2023) the values are unfortunately not time-adjusted or adapted to different markets. The initial ADEME work considers two components to calculate network-related electricity consumption for both fixed and mobile networks:- Component
a(dynamic): models the consumption of the network infrastructure per amount of transferred data, expressed in kWh per MB. - Component
b(static): models the consumption of the network infrastructure per user.
- 2.88 GB per hour for fixed networks (from the Carbon Trust study)
- 2.19 GB per hour for mobile networks (from Greenspector)
| Emission factor | Unit | Value |
|---|---|---|
| Electricity consumption of mobile networks | kWh per MB | 0.000117 |
| Embodied emissions of mobile networks | kgCO2e per MB | 0.0000087 |
| Electricity consumption of fixed networks | kWh per MB | 0.0000165 |
| Embodied emissions of fixed networks | kgCO2e per MB | 0.00000214 |
Power usage by time and bandwidth (Power Model)
Note: We have deprecated the use of the Power Model to align with GMSF 1.2. The information below is valid only for CTV‑BVOD and OLV measurements conducted before October 2025. Per Carbon Trust: This white paper presents a power model approach, which uses a marginal allocation methodology, where a baseload power is allocated per user, and a marginal energy component is allocated related to the data volume used. The power model approach recognises that the dynamic relation of energy to data volume in a network is very flat – i.e. there is a high fixed power baseload which does not vary in relation to the data volume, with only a small increase in power consumption in response to the data consumption.Fixed Network
Assumptions (see Table 5 in Carbon Trust doc):- We diverge from Carbon Trust in that we assume one active device per household member vs their assumption that half of all user devices are active - this represents multiple people watching the same TV, for instance, or streaming on a maximum of one personal device at a time (in other words, we set A = 1 and Qd = 1)
- We also do not include an idle factor as it does not make sense to us to include all of the other uses of the network, many work-related like video calls, in our calculation (in other words, we set F = 1)
- We assume an average household size of 2