Publisher Model
Publishers (media owners, platforms, etc) tend to be complex businesses, often with thousands of employees and complex organizational structures. Publishers often own and operate properties in different countries, sometimes with joint ventures, and have multiple revenue streams. Modeling the emissions for a single digital ad impression on a property requires three buckets of work: This model is intended to apply all digital media including web, mobile app, and CTV. DOOH should work but we have not thought through it fully. The examples below are generally built around web and need to be updated for other channels. At the bottom of this document we list some concerns and caveats.Visualizing the publisher model
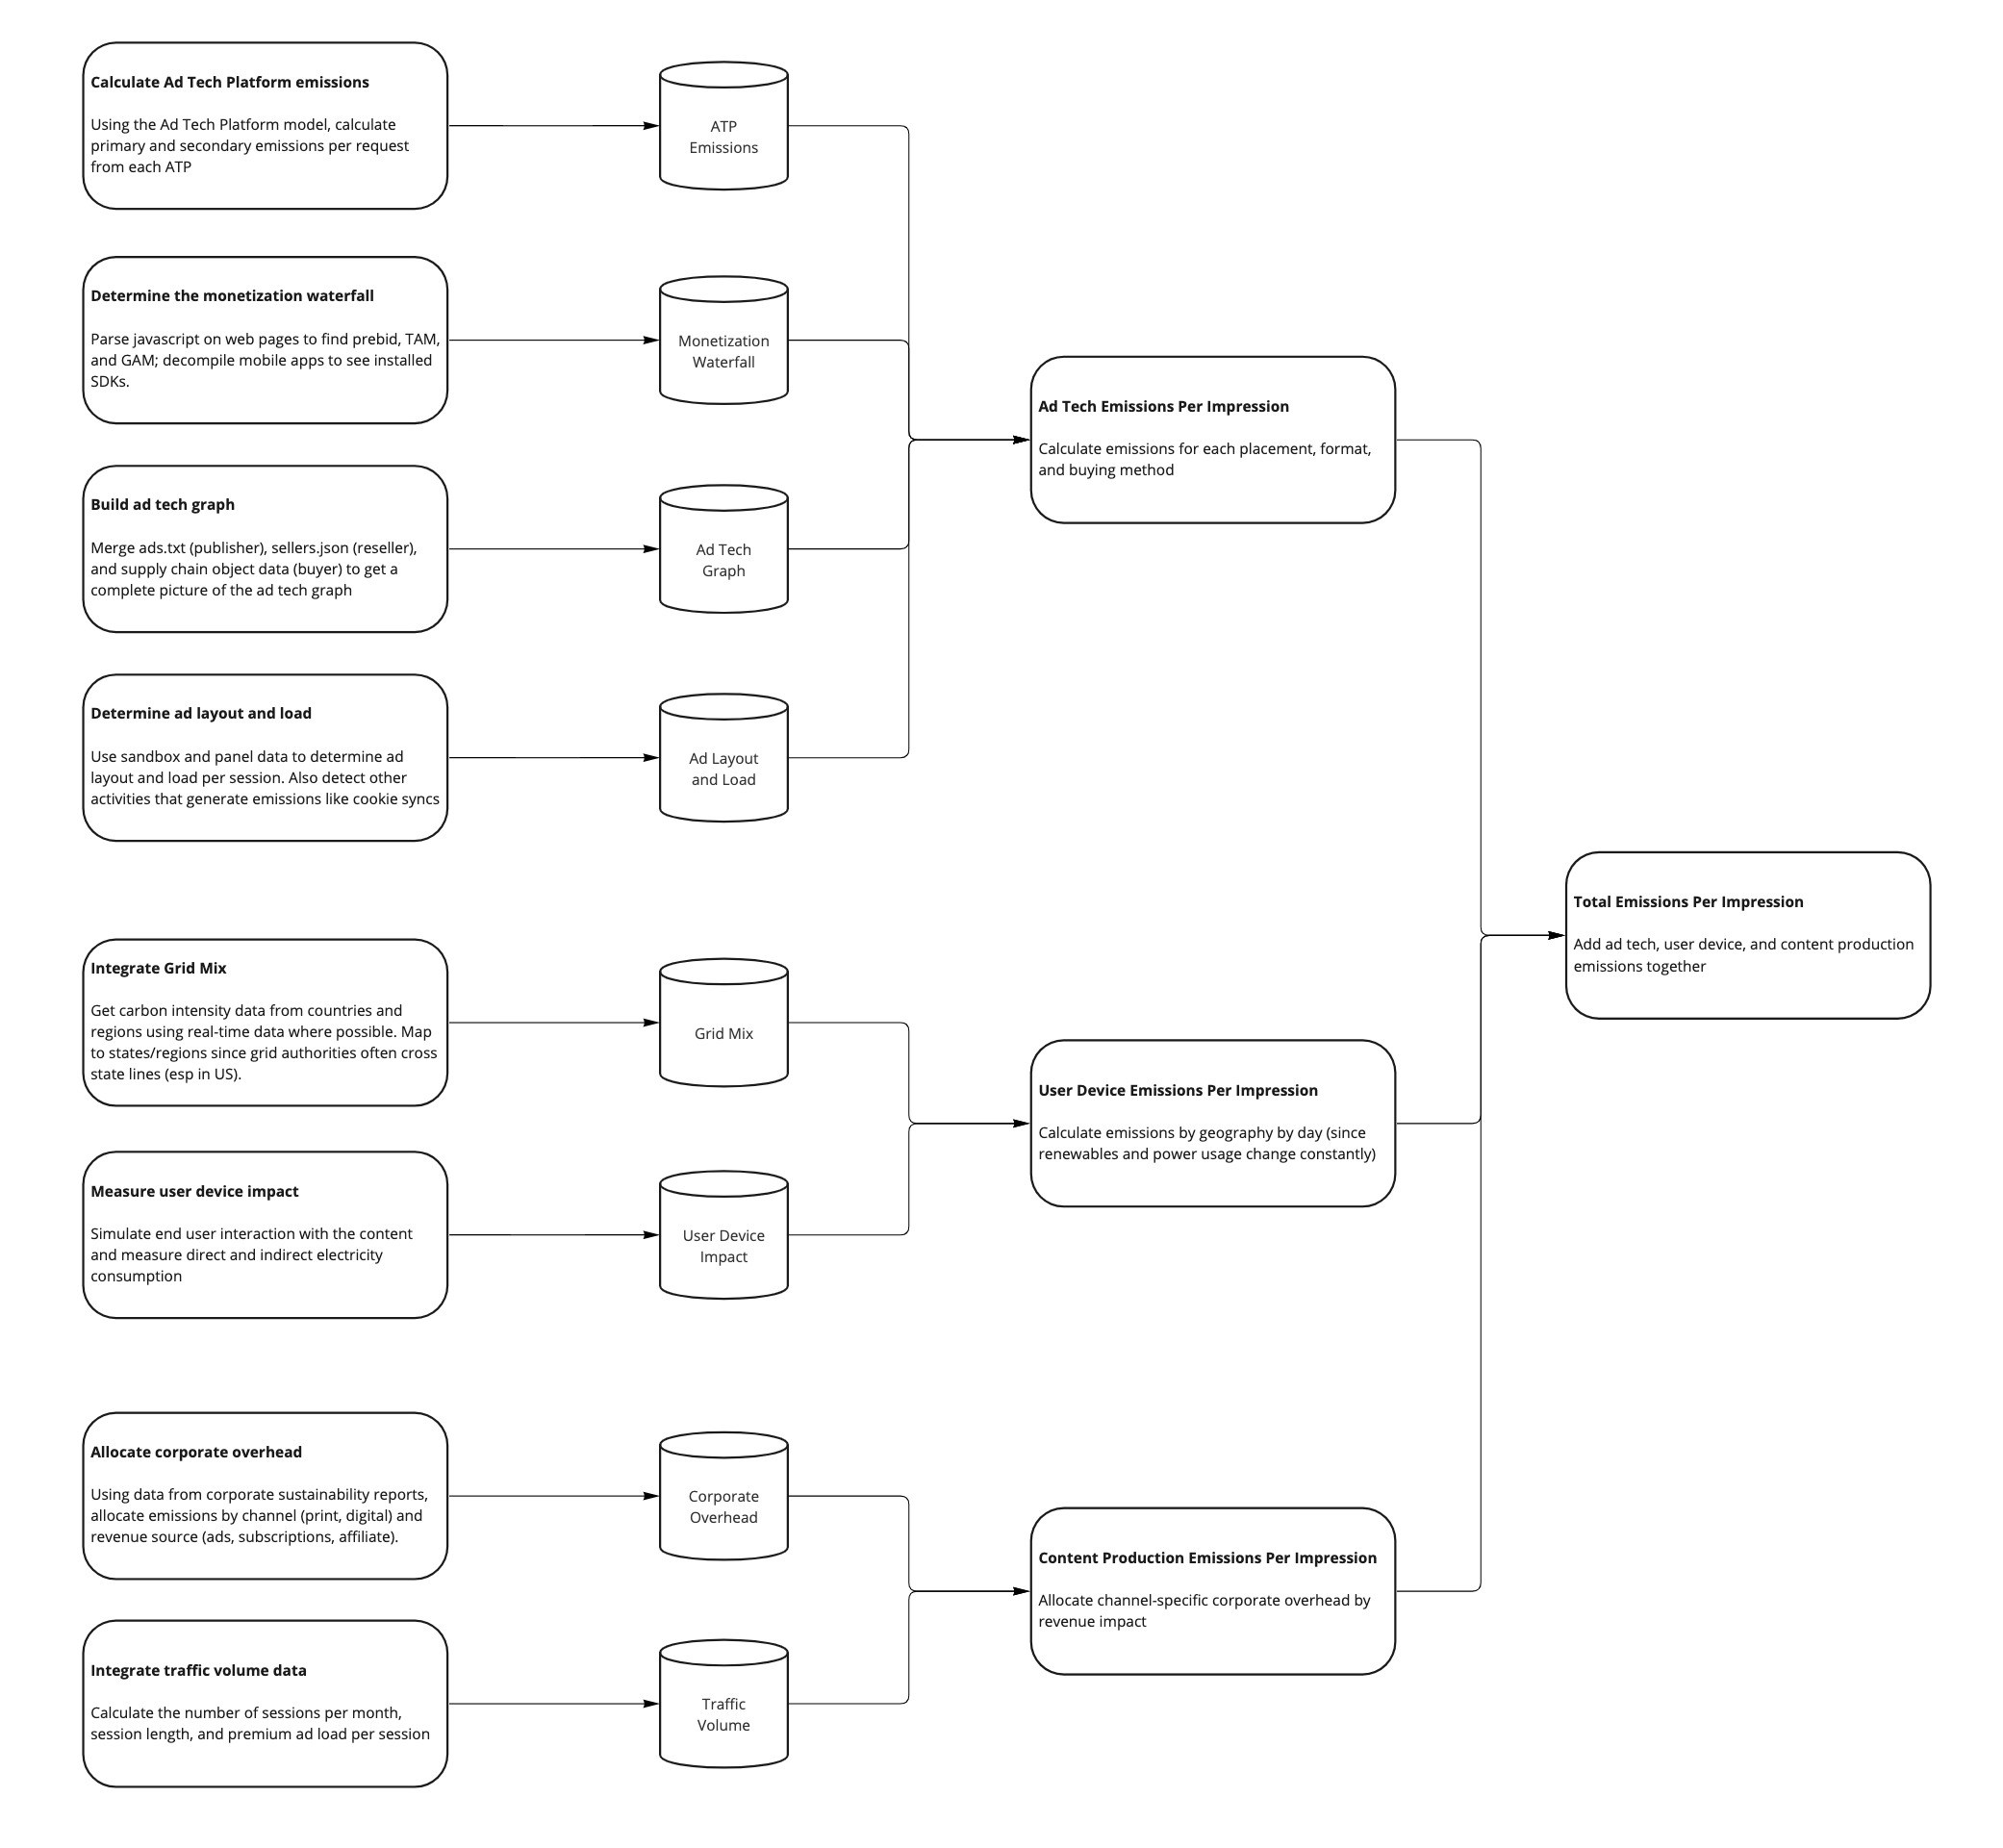
Computing Emissions from Ad Tech
There are three primary types of ad tech on publisher properties:- Core delivery systems - ad serving, order management systems (OMS), and data management platforms (DMP) - are used to deliver and track the bulk of the ads delivered by a publisher
- Programmatic ad tech is used to find incremental demand for ad impressions through a real-time auction. This process generally requires synching some kind of user identification with all of the ad tech companies, driving cookie syncs and the use of a consent management platform (CMP). We represent the multi-level auction as the “ad tech graph” since all of the calls made look like a directed acyclic? graph.
- Native ad networks insert ads into the content of the page without going through the ad server. These generally also interact with the programmatic ecosystem.
- Determine the waterfall used by the publisher so we can differentiate direct buys from programmatic buys, including the number of auctions run at each stage
- Determine the ad tech graph
- Use the Ad Tech Platform Model to determine emissions for each ad tech platform
The Monetization Waterfall
When publishers determine which ad to display to a user they generally have a priority system that can be visualized as a waterfall. First, serve a sponsorship (or guaranteed, or programmatic guaranteed) campaign if one is eligible to deliver. If not, the impression spills over to an auction where the highest value impression wins. There is often a third tranche where mediation will occur, which can be thought of as a daisy chain of ad networks. Finally, a house or public-service ad will act as a default if nothing else can deliver. In recent years, many publishers have adopted a unified yield strategy which runs the auction process before the sponsorship phase, enabling a high bid to preempt the sponsorship from serving. From a sustainability perspective, most of the emissions from ad tech happen during the auction phase. In the waterfall model, serving a sponsorship involves a few technology partners for the publisher (the ad server and DMP) and a few for the advertiser (their ad server and brand safety provider). In the unified yield model, every ad tech platform will engage to try to bid on the impression, making a sponsorship just as costly from an emissions perspective as a programmatic campaign. Many web publishers run multiple auctions on a single impression. The first auction is often Prebid.js running client-side, then one or more server-side auctions like Amazon’s TAM. Then the impression is passed to Google Ad Manager (GAM) which calls into its Open Bidding layer. Each of these auctions makes requests to multiple ad tech platforms (SSPs, ad networks, and/or exchanges), most of which will then make requests to other ad tech platforms. To understand how publishers interact with ad tech platforms, we need to know how many auctions they run and how these interact with each other and with the priority in the ad server. Generally, information about the monetization waterfall is not available in ads.txt or app-ads.txt. For websites, we can scan the code of the page to see client-side auctions like Prebid.js. For apps and server-side auctions, we need to get this information from publishers or make a best guess based on typical configurations.Mapping the ad tech graph
We use ads.txt to understand the direct and indirect ad tech platforms in the graph. There is risk here that publishers will not put all of their vendors in the ads.txt file, and we are relying on the increased enforcement from the programmatic ecosystem to make sure that these files are correct. We also strongly recommend that buyers stop purchasing “masked” inventory where the publisher or supply chain are obfuscated. Ads.txt file have a number of issues, including the lack of a geographic indicator. Publishers often share the same ads.txt file across multiple domains, which causes problems if each domain has a different publisher ID for a particular ad tech platform (it will look like that ATP is called multiple times on every domain, instead of once per domain). At Scope3, we have a secondary set of filters that we use to manually clean up this information, and we also work with publishers directly to make this as accurate as possible.Determining programmatic auctions
One challenge is understanding how many auctions a publisher operates. We can scan the code on a page to see, for instance, Prebid.js code. However, we can’t tell from the client side whether a publisher is using Google Open Bidding inside of GAM, or if they are running server-side auctions through Prebid Server or Amazon’s TAM.Calculating Consumer Device Emissions
To calculate the emissions from the consumer side of the media experience, we need to understand:- Emissions from the device being used to consume media
- Emissions from networking between the consumer device and the edge of the internet
- Emissions to get data from the core internet to the edge
- Grid mix at the consumer location
Consumer behavior and devices
One of the challenges we face is that advertisers generally do not know if a consumer is using a laptop or desktop. Some ad tech platforms provide data on computer vs tablet vs phone, and in the TV space, we may know whether we are working through a set-top box, smart TV, or a media gateway. However, we are unlikely to know whether the consumer is on wifi or ethernet, whether they are using a large TV or a small one, whether they have a monitor attached to their computer, and so forth. To best understand energy use across the various parts of a media property, we would want to sample user sessions and replicate their device and behavior. At Scope3, we license a consumer panel with 5M user devices that lets us simulate this at least to some degree of accuracy. For purposes of this open-source model, a simpler way to get the basic data about a website is to use Pingdom, which will scan a page of a site and provide basic metrics about page size, network requests, and load time (question: does this properly bypass cookie banners? If not, it understates emissions significantly). We can combine this data with the SimilarWeb data about pages per visit to estimate the time spent actively rendering a page and the time spent reading the content.Measuring energy use of consumer devices
To calculate the Lifecycle Emissions Per Second of Use (LEPS), we multiply the grid intensity of the consumer’s location (GI) and the power draw of the consumer device (UEPS) and add this to the production energy per second (PEPS).LEPS = PEPS + GI • UEPS
See consumer device emissions for details on how we calculate the UEPS and PEPS for each device type.
We multiply the LEPS by the average session time for each property to find the lifecycle emissions per session.
As an example, SimilarWeb shows BZ as having average visit duration of 120 seconds. For a personal computer with a power draw of 53.2 watts and a grid intensity of 500 gCO2e/kWh, we calculate use energy of 0.0073 gCO2e/s. Added to the production emissions of 0.007 gCO2e/s, we get a total of 0.0143 gCO2e/s. For a 120 second session, that would be a total of 1.716 gCO2e, which we would then divide by the number of ads seen.
Assessing the carbon footprint of network traffic
See Emissions from data transfer.Grid mix
There are (at least) two companies that provide grid mix data for a broad range of companies and regions: Electricity Map and Watt Time. Each of these can provide data on the current and historical carbon intensity of the electricity grid. They use slightly different methodologies (Electricity Map uses average intensity; Watt Time is marginal intensity) and have different coverage areas. In both cases, it is necessary to map from grid regions to administrative regions (states and provinces) in countries like the US. At Scope3, we subscribe to Watt Time and use their API; in this open source repo you can pass the carbon intensity into the model on the command line.Corporate Emissions
The final part of the publisher model is to allocate corporate overhead - representing the emissions from content production, monetization, and marketing - to each impression. We do this by calculating corporate emissions per month and dividing by the number of ads per month.Calculating corporate emissions
See Corporate EmissionsAllocation of corporate emissions by channel and business model
For a digital property, we attempt to allocate only the digital ad revenue for each publisher, excluding print and other channels as well as revenue from subscriptions and affiliate programs. (TODO)Allocation of corporate emissions to properties
We allocate corporate emissions to properties based on relative time spent across properties. This could also be done based on raw traffic or revenue - curious if there are any standards or best practices (or opinions!) around this. For purposes of the open source repo, we suggest using SimilarWeb to add facts to theproperties object for visits_per_month and average_visit_duration_s. We sum these to produce total publisher time, and then assign to each property based on property time divised by total publisher time.
Quality ads per month
We can pull session information from SimilarWeb for each of the publisher’s properties to determine the number and length of sessions for each. To determine ads per session, Scope3 uses a crawler to detect ads per page, but we have found a number of issues with this approach:- Ad layouts can be dramatically different on a site’s home page vs internal pages
- It is difficult to trigger ads in every type of content (for instance, a mobile game may only show an incentivized ad after a certain amount of playing the game)
- Our scanner is technically a bot and should not actually see ads if ad tech companies are doing their job properly
- Infinite scroll layouts are complicated to measure accurately. How far should we scroll?
- If we divide corporate emissions by the actual number of ad slots on a page, that implies that all ads are created equal. Does a tiny ad at the bottom of a long page actually contribute equally to revenue as a very prominent ad at the top?
Sample publisher YAML
This is an example of the minimal YAML that would be passed into./scope3_methodology/cli/model_publisher_emissions.py to produce an estimate of emissions. This does not include emissions from the ad tech supply chain.